. 2019 May 29;9(29):16738–16745. doi: 10.1039/c8ra10245g

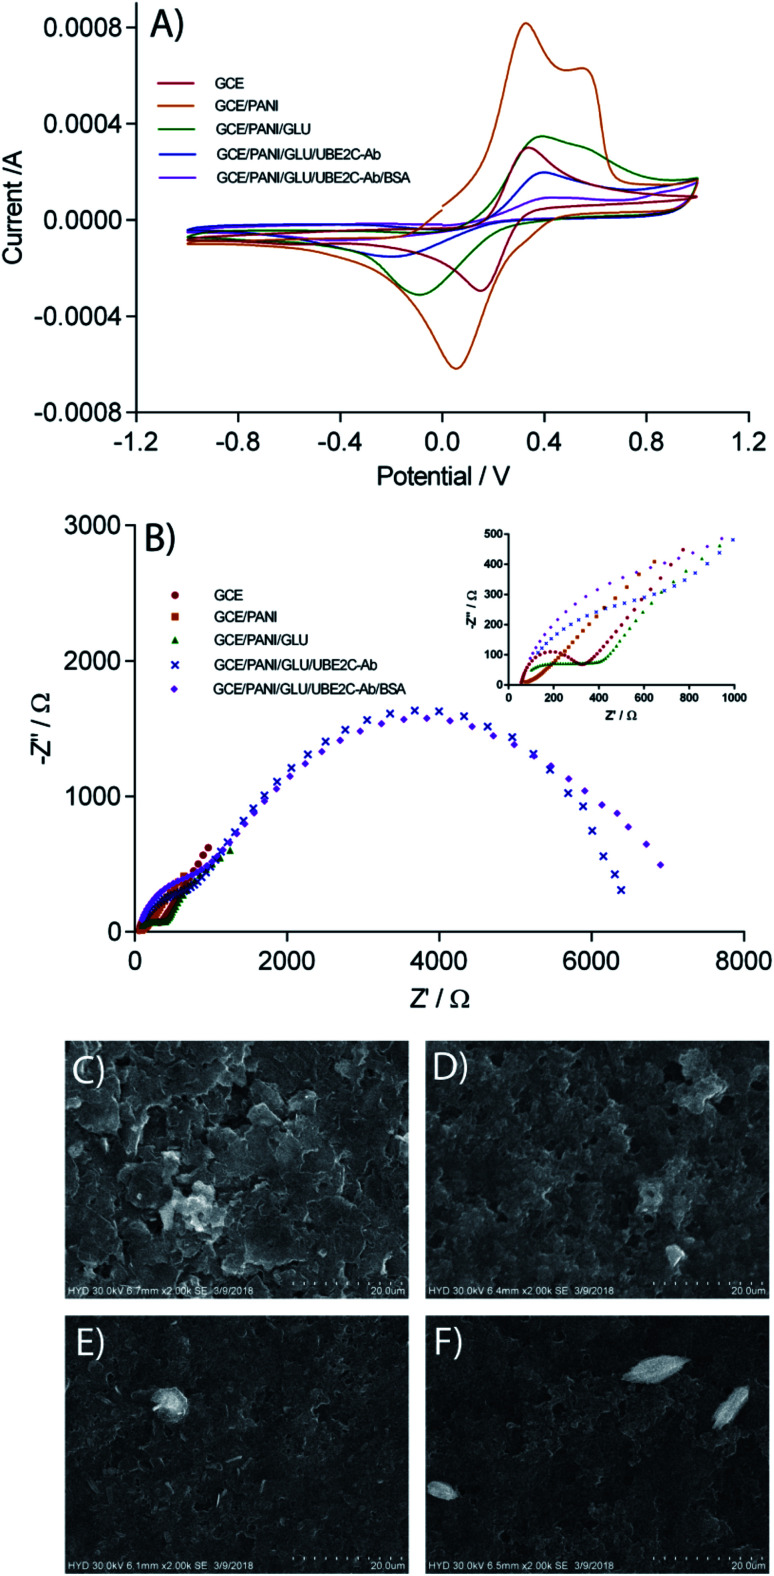
Fig. 2. Characterization of the UBE2C immunosensor. (A) Cyclic voltamograms of GCE, GCE/PANI, GCE/PANI/GLU, GCE/PANI/GLU/UBE2C-Ab, and GCE/PANI/GLU/UBE2C-Ab/BSA electrodes in 0.1 M PBS (pH 7.4) with 5.0 mM [K3Fe(CN)6/K4Fe(CN)6] and 0.1 M KCl. Scan rate: 100 mV s−1. (B) Electrochemical impedance spectra obtained at GCE, GCE/PANI, GCE/PANI/GLU, GCE/PANI/GLU/UBE2C-Ab, and GCE/PANI/GLU/UBE2C-Ab/BSA electrodes 0.1 M PBS (pH 7.4) with 5.0 mM [K3Fe(CN)6/K4Fe(CN)6] and 0.1 M KCl. EIS measurements were carried out with an alternating wave of 10 mV amplitude in the frequency range between 10 000 and 0.05 Hz. (B) inset: enlarged impedance spectra. (D–G) SEM images of different electrode surfaces obtained during the immunosensor fabrication. (C) CE, (D) CE/PANI, (E) CE/PANI/GLU, (F) CE/PANI/GLU/UBE2C-Ab (enlarged version of SEM is provided in ESI Fig. S4).

Fig. 2