. 2019 May 29;9(29):16738–16745. doi: 10.1039/c8ra10245g

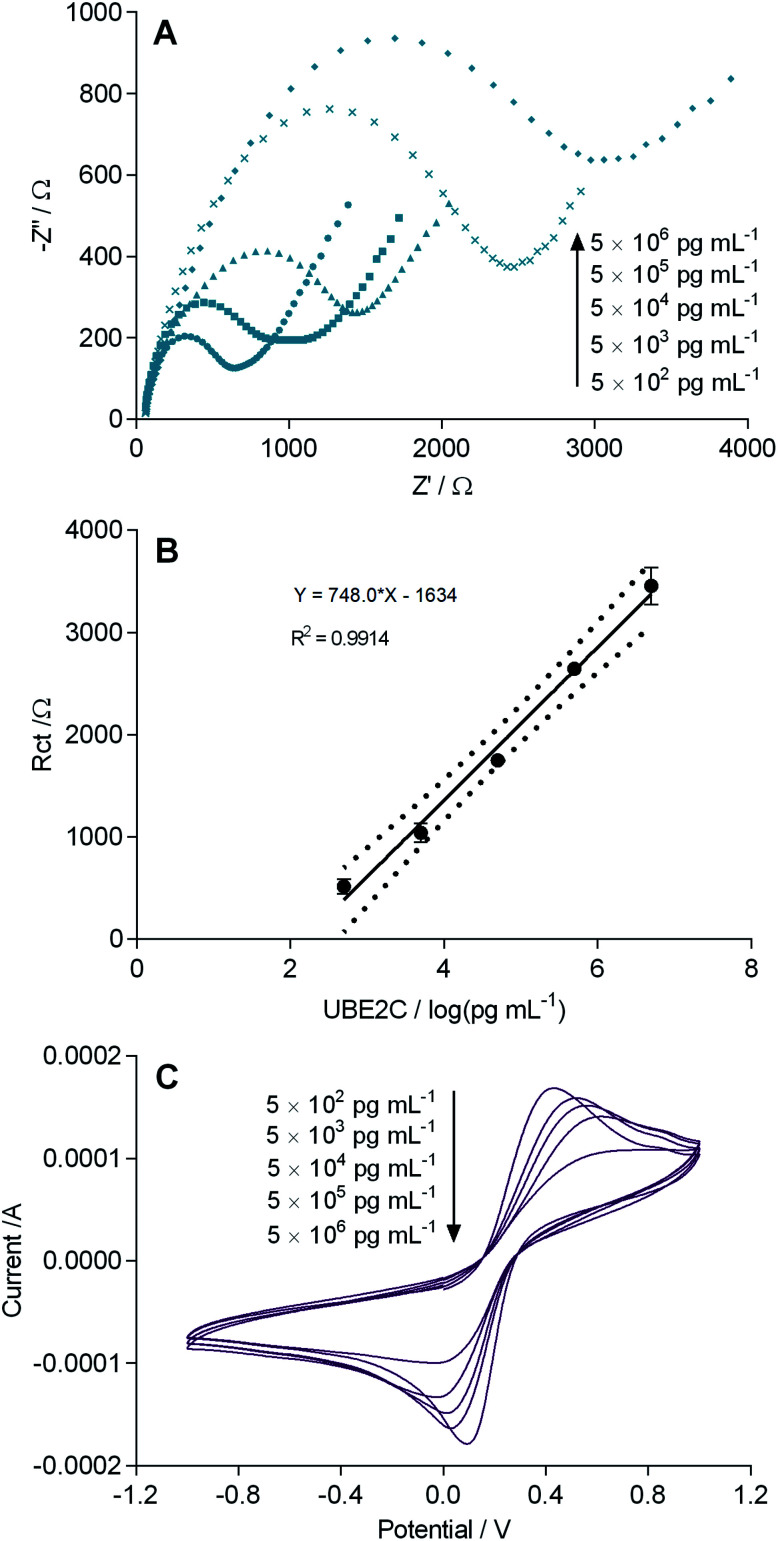
Fig. 3. (A) Electrochemical impedance spectra obtained after incubation of the immunosensor (GCE/PANI/GLU/UBE2C-Ab/BSA) with increasing concentrations of UBE2C. EIS measurements were carried out with an alternating wave of 10 mV amplitude in the frequency range between 10 000 and 0.05 Hz in 0.1 M PBS (pH 7.4) with 5.0 mM [K3Fe(CN)6/K4Fe(CN)6] and 0.1 M KCl. (B) Calibration plot of the immunosensor with increasing concentrations of UBE2C. Each datum point represents the average of the analysis of quadruplicate values (n = 4). Dotted lines represents the 95% confidence interval of each datum point. Error bars correspond to the standard deviation (SD) of four measurements (n = 4) under each condition. (C) Cyclic voltammograms obtained after incubation of the immunosensor (GCE/PANI/GLU/UBE2C-Ab/BSA) with increasing concentrations of UBE2C. CV was carried out in 0.1 M PBS (pH 7.4) with 5.0 mM [K3Fe(CN)6/K4Fe(CN)6] and 0.1 M KCl. Scan rate: 100 mV s−1.

Fig. 3