. 2019 May 31;9(30):16929–16947. doi: 10.1039/c9ra01253b

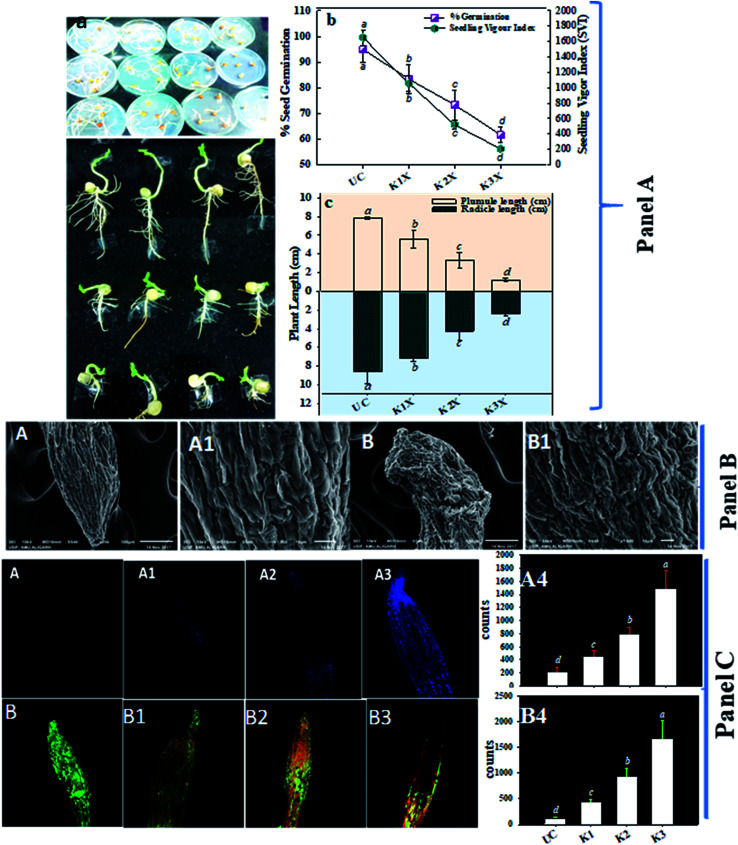
Fig. 4. Panel (A) represents the toxic and inhibitory impacts of fungicide on seeds germinated on 0.7% soft agar plates amended with 0 (control), 1×, 2× and 3× concentrations of kitazin (a), % seed germination and seedling vigor index (b), length of radicle and plumule after 5 days of germination (c). Each value is a mean of five replicates (n = 5) where each replicate constituted five seeds/plates. Mean values followed by different letters are significantly different at p ≤ 0.05 according to DMRT test. Vertical bars represent means ± SD (n = 5). ANOVA significant at p ≤ 0.05. Panel (B) represents the SEM micrograph of P. sativum roots grown on soft agar under in vitro conditions: (A) and (A1) are root tip and root surface of untreated control, whereas, (B) and (B1) shows damaged/fractured and fissures in kitazin treated root tip and surface, respectively. Panel (C) shows the Z-stack CLSM micrographic analysis of P. sativum roots; (A), (A1), (A2) and (A3) depicts the cytotoxicity (Evans blue dye exclusion) assay; figures shows the uptake of Evans blue dye by root cells; (A) is untreated control showing no blue colour, whereas, (A1), (A2) and (A3) are 1×, 2× and 3× kitazin treated roots showing the uptake of dye, respectively. As the conc. of fungicides increased, the intensity of blue fluorescence increased. (B), (B1), (B2) and (B3) represents the 0 (untreated control), 1×, 2× and 3× kitazin treated, respectively and propidium iodide (PI)/acridine orange (AO) stained roots of P. sativum represent the oxidative stress and cellular damage induced by fungicides. Images reveal an increase in red/orange fluorescence as the concentrations of fungicides increases.

Fig. 4