. 2019 May 31;9(30):16929–16947. doi: 10.1039/c9ra01253b

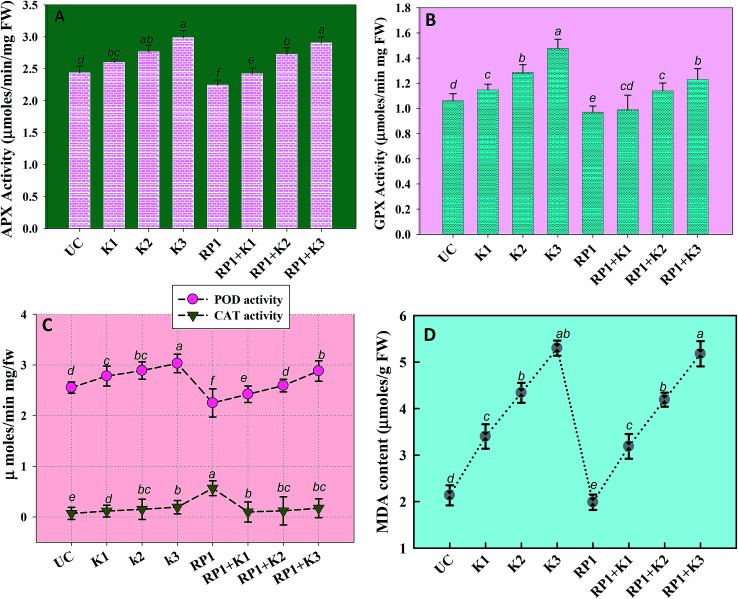
Fig. 8. Antioxidant enzyme activity and lipid peroxidation (malondialdehyde content) extracted from foliage of P. sativum plants grown in the presence of fungicide tolerant bacterial inoculant (strain RP1) and treated with varying concentrations of kitazin; APX activity (A), GPX activity (B), POD and CAT activity (C) and MDA content (D). Each value is a mean of three independent replicates (n = 3) where each replicate constituted three plants/pot. Mean values followed by different letters are significantly different at p ≤ 0.05 according to DMRT test. Vertical and scattered bars represent means ± SD (n = 3). ANOVA significant at p ≤ 0.05.

Fig. 8