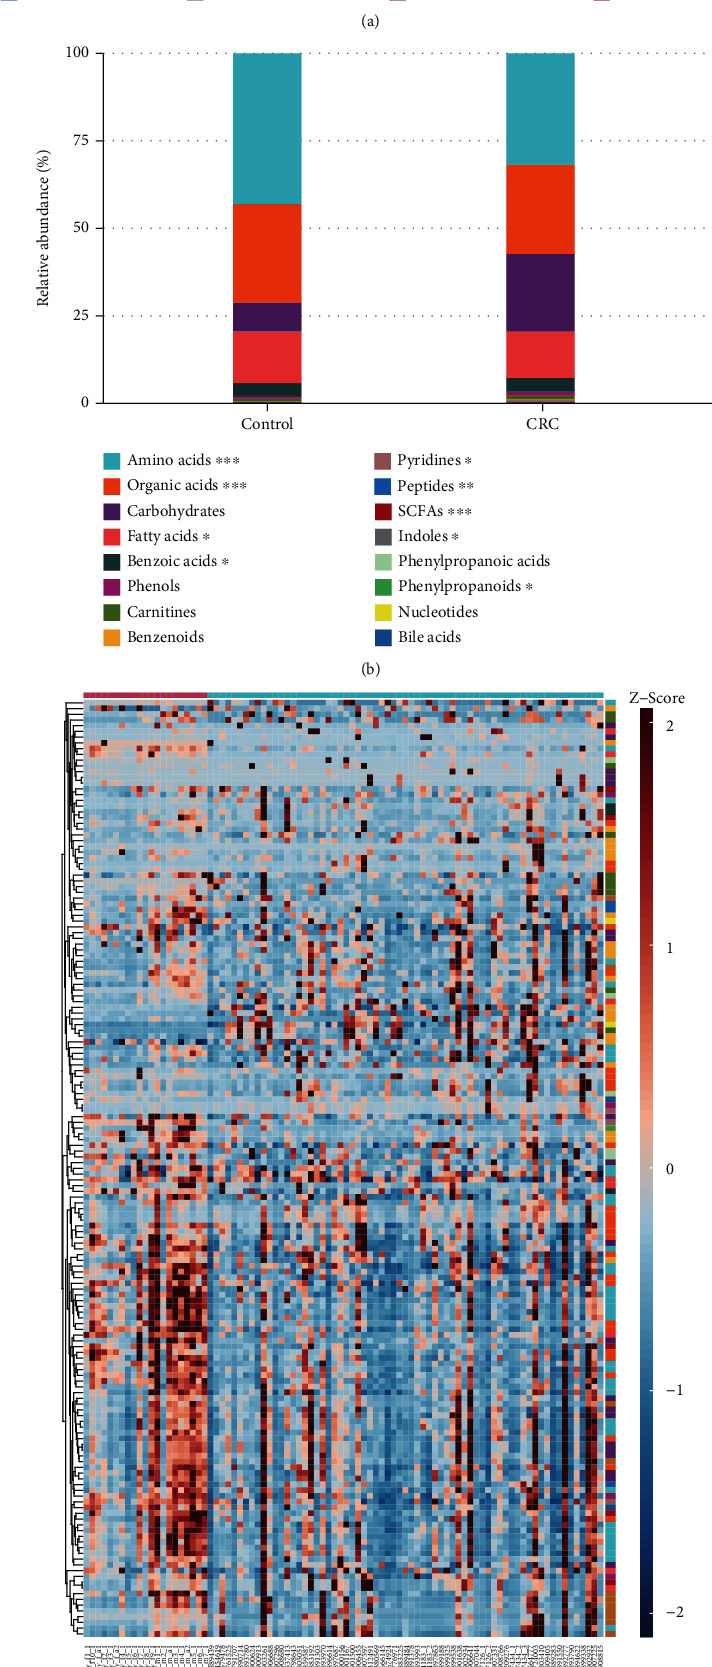
Figure 1.

Metabolite profile of CRC patients (n =67) and healthy control (n =21). (a) Relative abundance of urinary metabolites classes in CRC and control group. (b) Relative abundance of urinary metabolites classes in CRC and control samples. (c) Heatmap of urinary metabolites concentrations (Z-score scale to -2~2)in CRC patients and controls.
