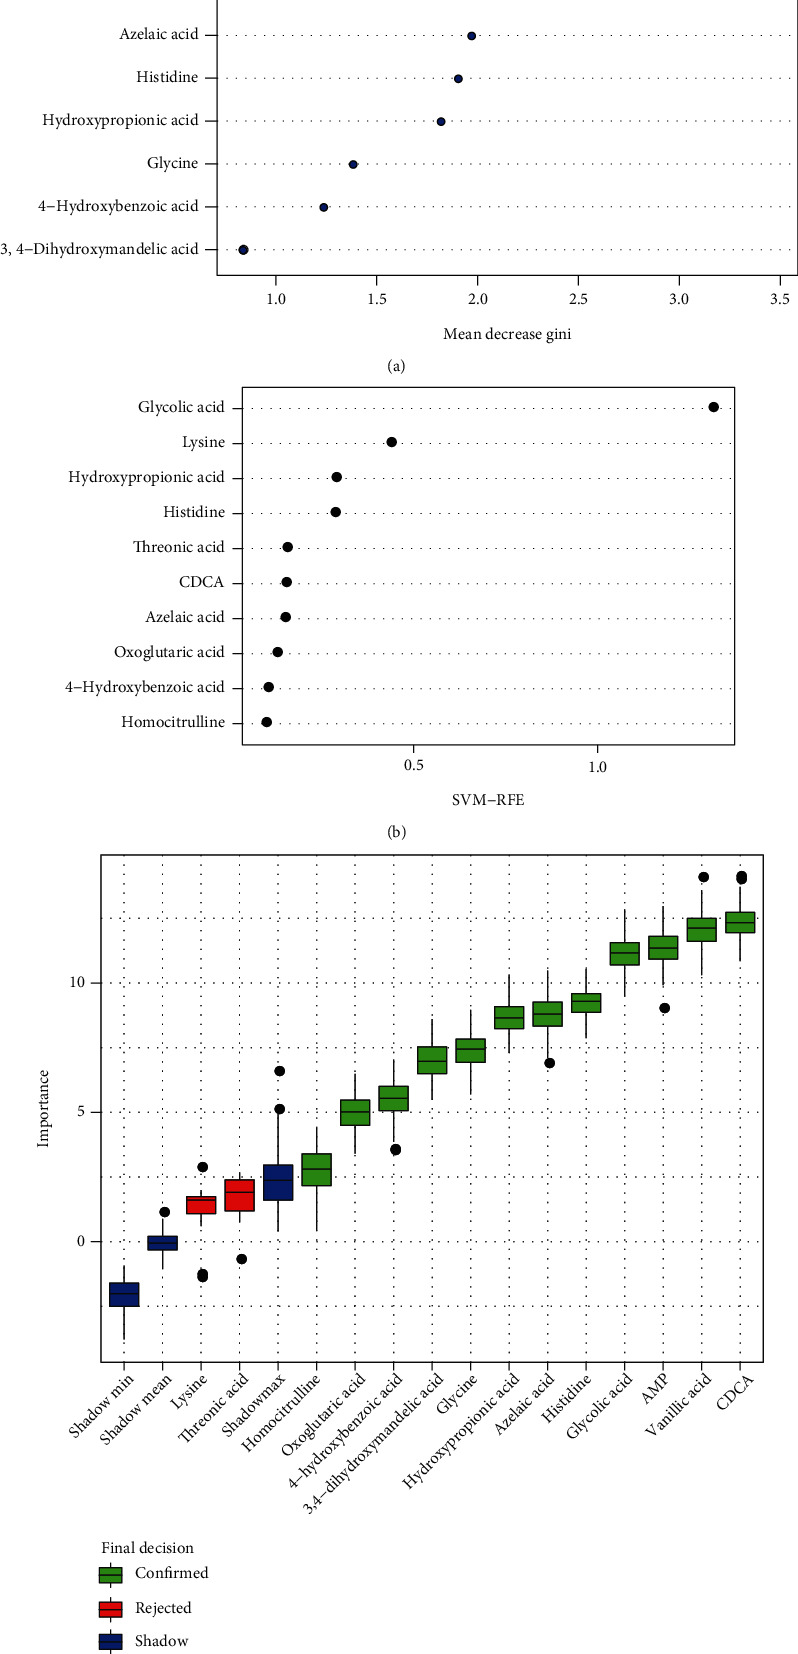
Figure 5.

Identification of biomarkers for CRC by Random Forest, Support Vector Machine, and Boruta analysis. (a) Metabolite importance plot of Random Forest analysis calculated by Mean Decrease Gini for classification between CRC patients and healthy controls (top 10 metabolites). (b) Metabolite importance plot of Support Vector Machine analysis calculated by recursive feature elimination (RFE) for classification between CRC patients and healthy controls (top 10 metabolites). (c) Box plot of Boruta analysis for the relevant feature selection of potential biomarker (blue box correspond to minimal, average and maximum Z-score of a shadow attribute; green and red box correspond to the confirmed and the rejected attributes, respectively).
