
Figure 4.
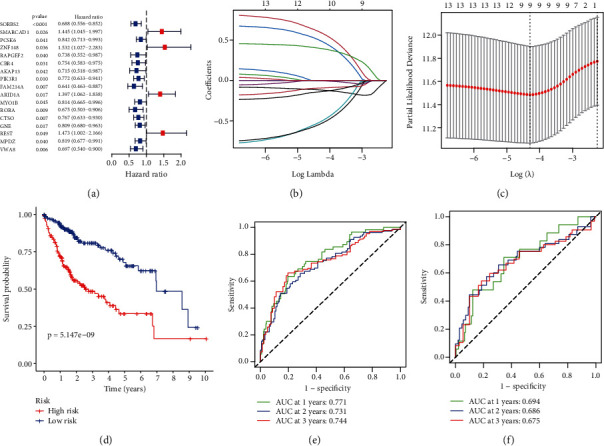
Risk model and the Kaplan-Meier curves for the OS in HCC patients based on RAPGEF2 and its related genes. (a) The univariate Cox regression analysis demonstrated a substantial correlation between the identified genes and clinical prognosis. (b) To cross-validate the error curve, the tuning parameters (log λ) of OS-related proteins were selected. Perpendicular imaginary lines were drawn at the ideal value using the minimum and 1-se criterion. (c) The LASSO coefficient profile of 13 OS-associated genes was drawn together with the perpendicular imaginary line at the value determined by 9-fold cross-validation. (d) Kaplan-Meier curves for the OS of patients in TCGA database who were classified as high-risk or low-risk. (e) ROC analysis using TCGA database. (f) ROC analysis using the ICGC database.