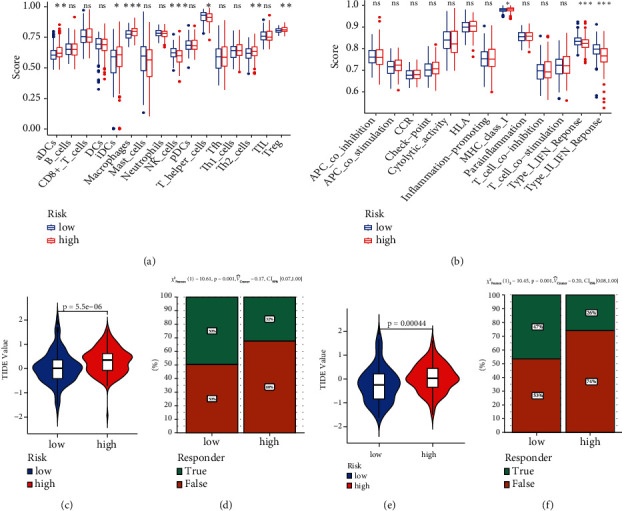
Figure 5.

Relationship among risk model, immune infiltration tumor immune dysfunction exclusion, and immunotherapy response to HCC patients. (a) The scores of 16 immune cells. (b) The scores of 13 immune-related functions. (c) The value of the TIDE from TCGA database. (d) The response to immunotherapy from TCGA database. (e) The value of the TIDE from ICGC database. (f) The response to immunotherapy from ICGC database. (∗P < 0.05; ∗∗P < 0.01; ∗∗∗P < 0.001; ns: no significant).
