. 2019 Jun 4;9(30):17501–17513. doi: 10.1039/c9ra02473e

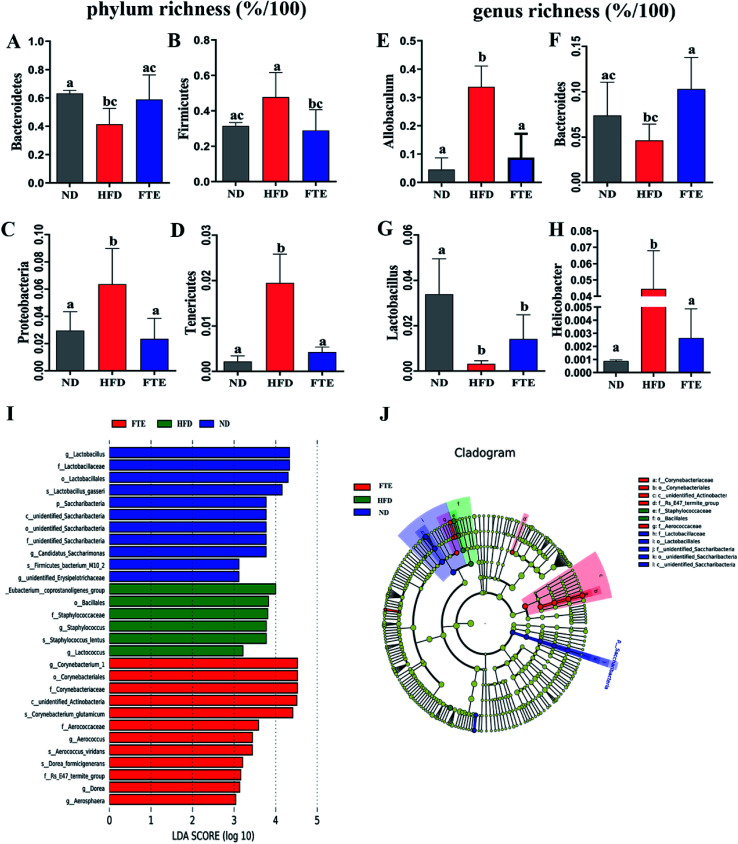
Fig. 6. Changes in the intestinal microbiota in FTE-fed mice as compared to HFD control. The relative abundance of (A) Bacteroidetes, (B) Firmicutes, (C) Actinobacteria, (D) Proteobacteria, (E) Allobaculum, (F) Bacteroides, (G) Lactobacillus, and (H) Helicobacter. Bars represent the mean ± SD (n = 10). Different letters indicate significant statistical differences among groups at p < 0.05. (I and J) Linear discriminative analysis (LDA) effect size (LEfSe) analyses of statistically significant taxa. Taxa were sorted by degree of difference and overlaid on a taxonomic cladogram. Only the taxa meeting a significant LDA threshold value of >3.0 are shown.

Fig. 6