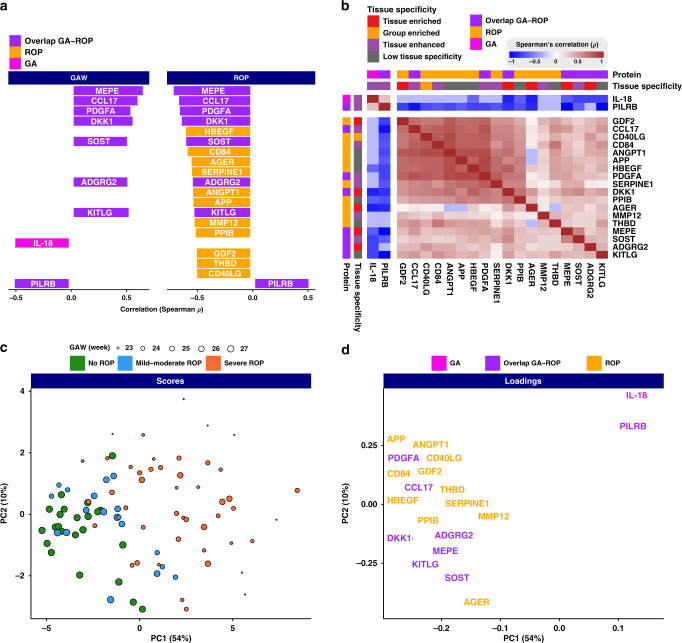
Fig. 3. Correlation to gestational age (GA) and retinopathy of prematurity (ROP), co-expression, and protein profiles depending on ROP status for the 20 most significantly correlated proteins.
a Positive or negative correlation to GA and/or ROP. Most proteins positively correlated to GA is negatively correlated to ROP; the size of the box corresponds to the level of correlation on the x-axis. b Co-expression analysis showing the correlation in-between the individual proteins. Two main clusters were observed. c Principal component analysis (PCA) demonstrated clustering trends regarding GA and stage of ROP. Each individual blood sample has a distinct protein profile depending on the infants’ GA at birth and later ROP development. d The loadings plot of the PCA shows the relationships between covarying proteins and demonstrates the certain proteins underlying the sample-related clustering patterns.

