. 2022 Feb 16;28(9):1863–1870. doi: 10.1158/1078-0432.CCR-21-3018

Figure 3.

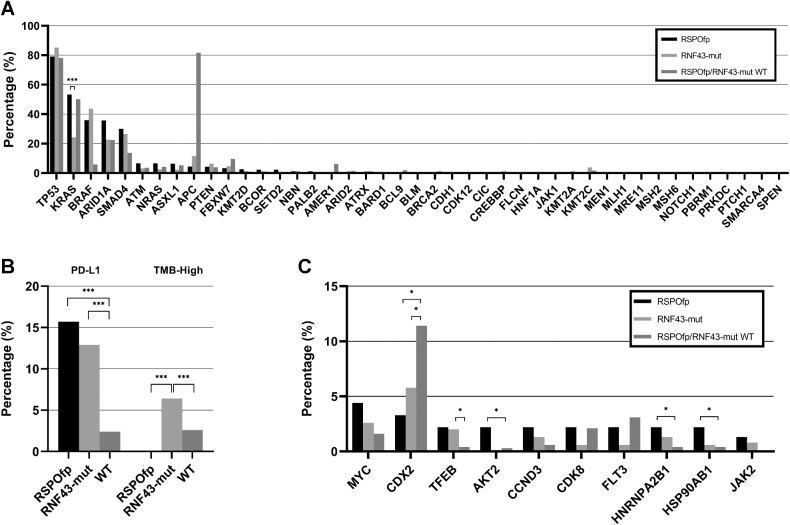
Figure 3. Molecular landscape of the MSS subcohort. A, Genetic landscape comparison between RSPOfp and RNF43-mut tumors in the MSS subgroup. KRAS mutation was the only statistically different genetic alteration. ***, q < 0.001. B, TMB and PDL-1 status in RNF43-mut, RSPOfp and RNF43/RSPOfp-WT colorectal cancers. None of the RSPOfp patients showed a TMB >10 mt/Mb or an MSI-H/dMMR status; *, q < 0.05; ***, q < 0.001. C, Copy-number alterations in RNF43 mutations, RSPO rearrangements, and RNF43/RSPO-WT samples; *, q < 0.05.

Molecular landscape of the MSS subcohort. A, Genetic landscape comparison between RSPOfp and RNF43-mut tumors in the MSS subgroup. KRAS mutation was the only statistically different genetic alteration. ***, q < 0.001. B, TMB and PDL-1 status in RNF43-mut, RSPOfp and RNF43/RSPOfp-WT colorectal cancers. None of the RSPOfp patients showed a TMB >10 mt/Mb or an MSI-H/dMMR status; *, q < 0.05; ***, q < 0.001. C, Copy-number alterations in RNF43 mutations, RSPO rearrangements, and RNF43/RSPO-WT samples; *, q < 0.05.