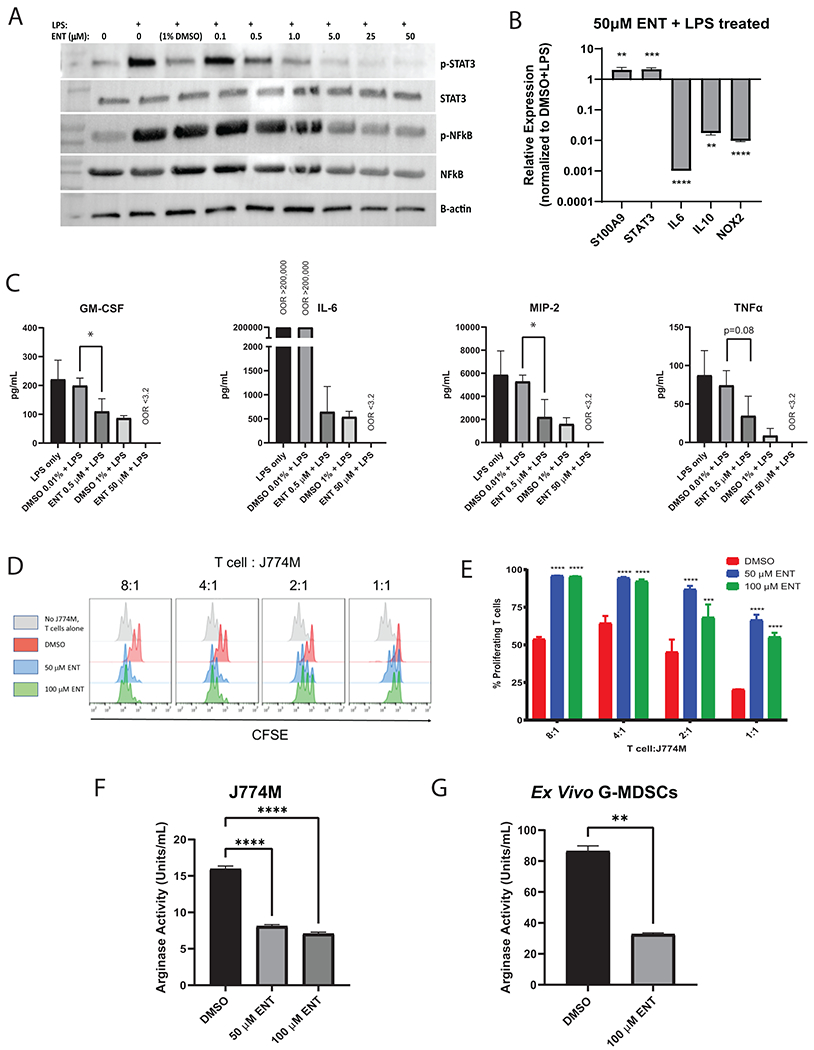
Figure 4. Effects of entinostat are mediated by STAT3 and NFkB pathway modulation.

A. J774M cells pre-treated with varying concentrations of entinostat overnight were stimulated with LPS for 2 hours. Western blot depicts lysates probed for phospho-(p)STAT3, STAT3, pNFκB, NFκB, and beta-actin. B. qPCR of inflammatory genes, S100a9, Stat3, Il6, Il10, and Nox2 was performed on J774M cells treated with 50 μM entinostat (ENT) for 16 hours stimulated with LPS. Error bars represent SD from 3 replicates. Experiment was repeated 3 times. C. Multiplex analysis of cytokines released in vitro. Error bars represent SD from 3 repeated experiments. OOR: out of range. 0.01% DMSO was the control for 0.5 μM ENT and 1% DMSO was the control for 50 μM ENT. D. CFSE-labeled T cells stimulated with anti-CD3/CD28 beads for 52 hours at the indicated E:T ratio with J774M cells were analyzed by flow cytometry. Each peak represents a cell division as determined by CFSE dilution. E. Quantification of percentages from (D) of proliferating CD8+ T cells in each treatment group compared to the DMSO control. Error bars represent SD from replicates. Experiment was repeated twice. F-G, J774M cells (F) and Ly6G+ G-MDSCs (G) isolated from tumors of untreated NeuN mice were treated with entinostat ex vivo for 16 hours in tumor conditioned media before arginase activity was measured. Error bars represent SD from 3 replicates, with experiments repeated twice. Statistically significant p values: *p<0.05, **p<0.01, ***p<0.001, ****p<0.0001.
