
Figure 2: Volcano plot of genes differentially expressed in normal and ovarian tumor tissue pre vs post HIPEC with platinum exposure.
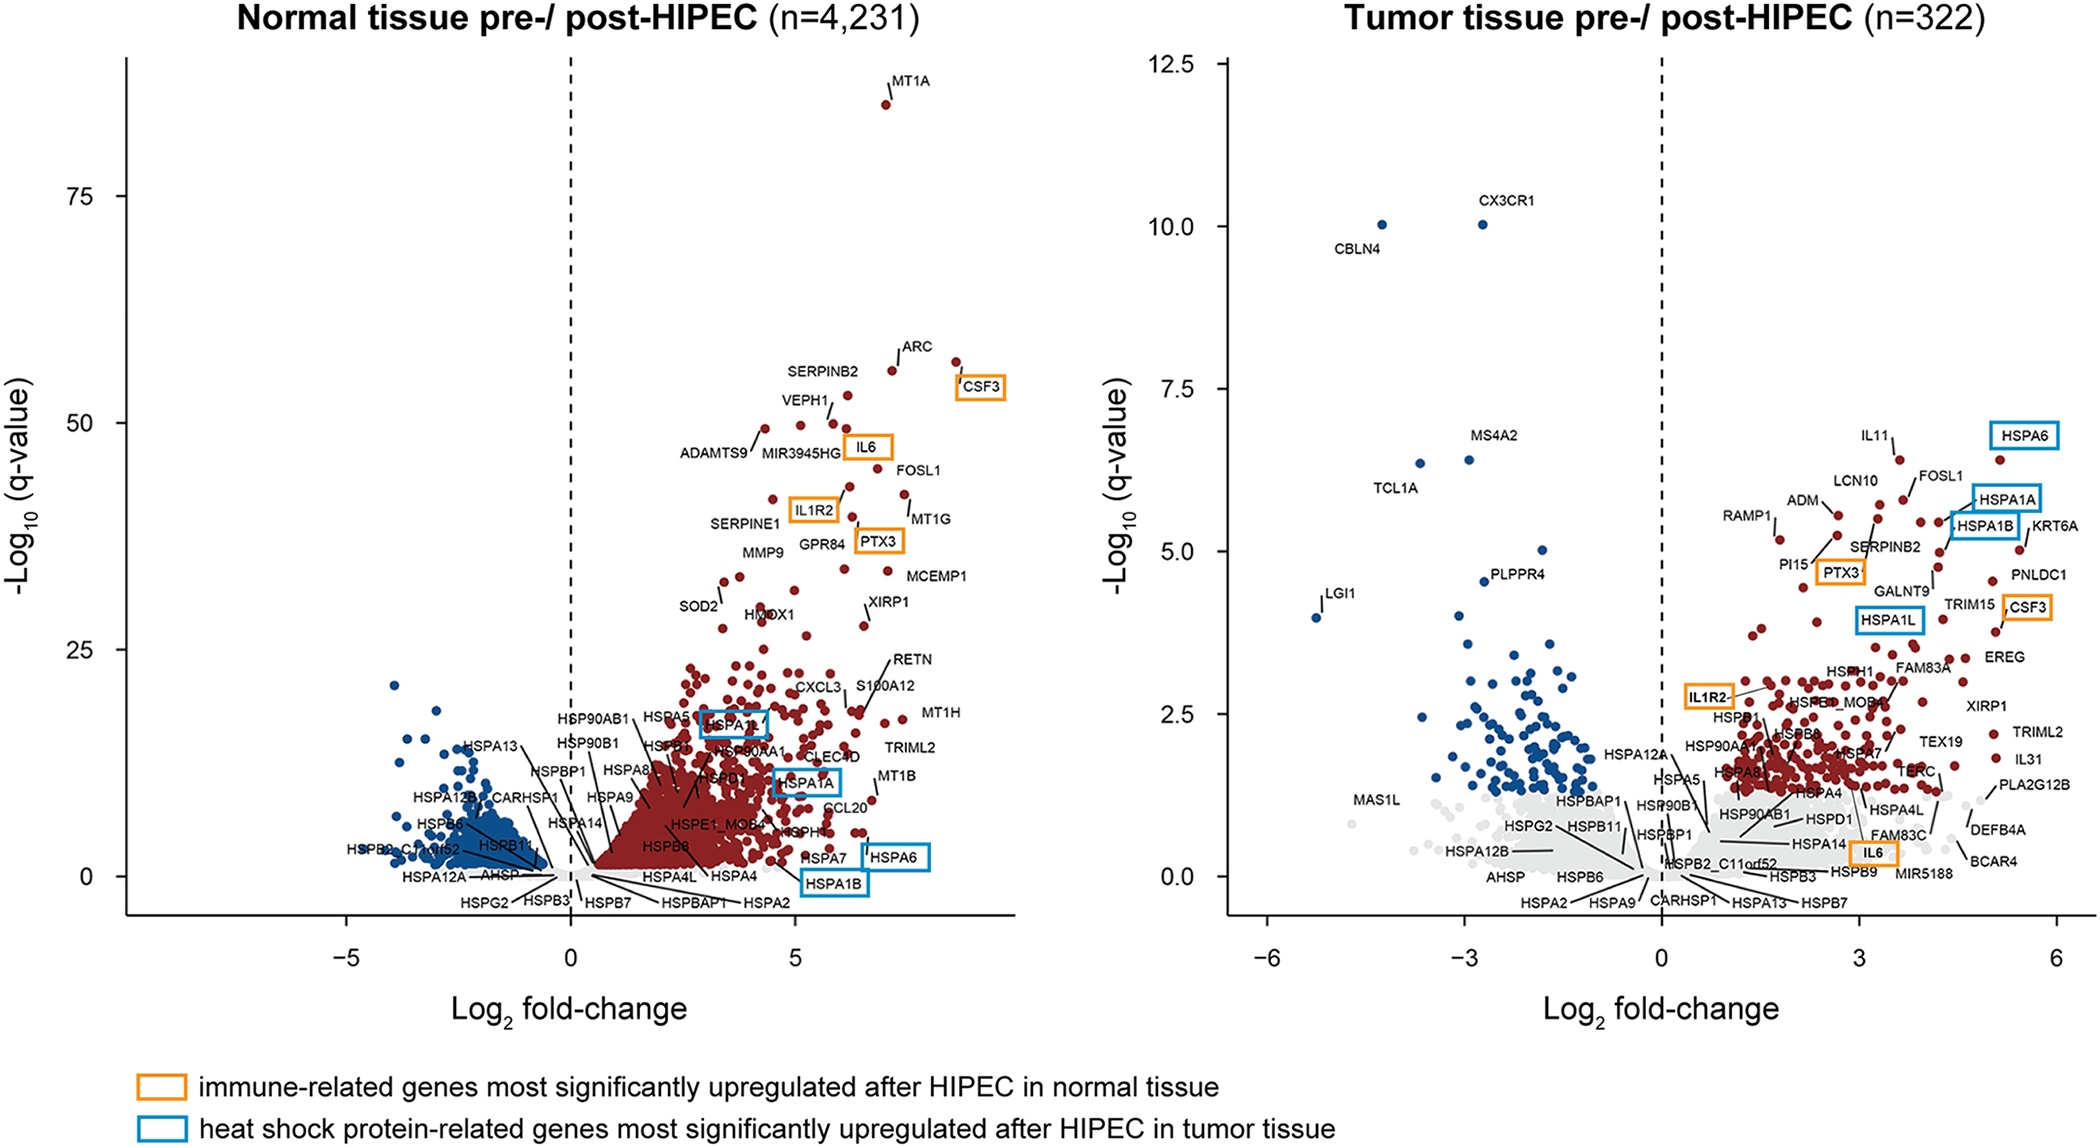
Differentially expressed genes after HIPEC with platinum exposure in normal (left) and tumor (right) tissues, plotted as Log2 fold-change in the x-axis and −Log10 q-value on the y-axis. Expression of genes colored as red (up-regulation) and blue (down-regulation) dots has significantly changed after HIPEC with platinum exposure with a p-value <0.05 and a Log2 fold-change >1.5. Genes highlighted with a yellow box represent the four most significantly upregulated genes related to immune response after HIPEC in normal tissue, whereas those with a light blue box represent the four most significantly upregulated genes after HIPEC in tumor tissue, which are heat shock proteins.