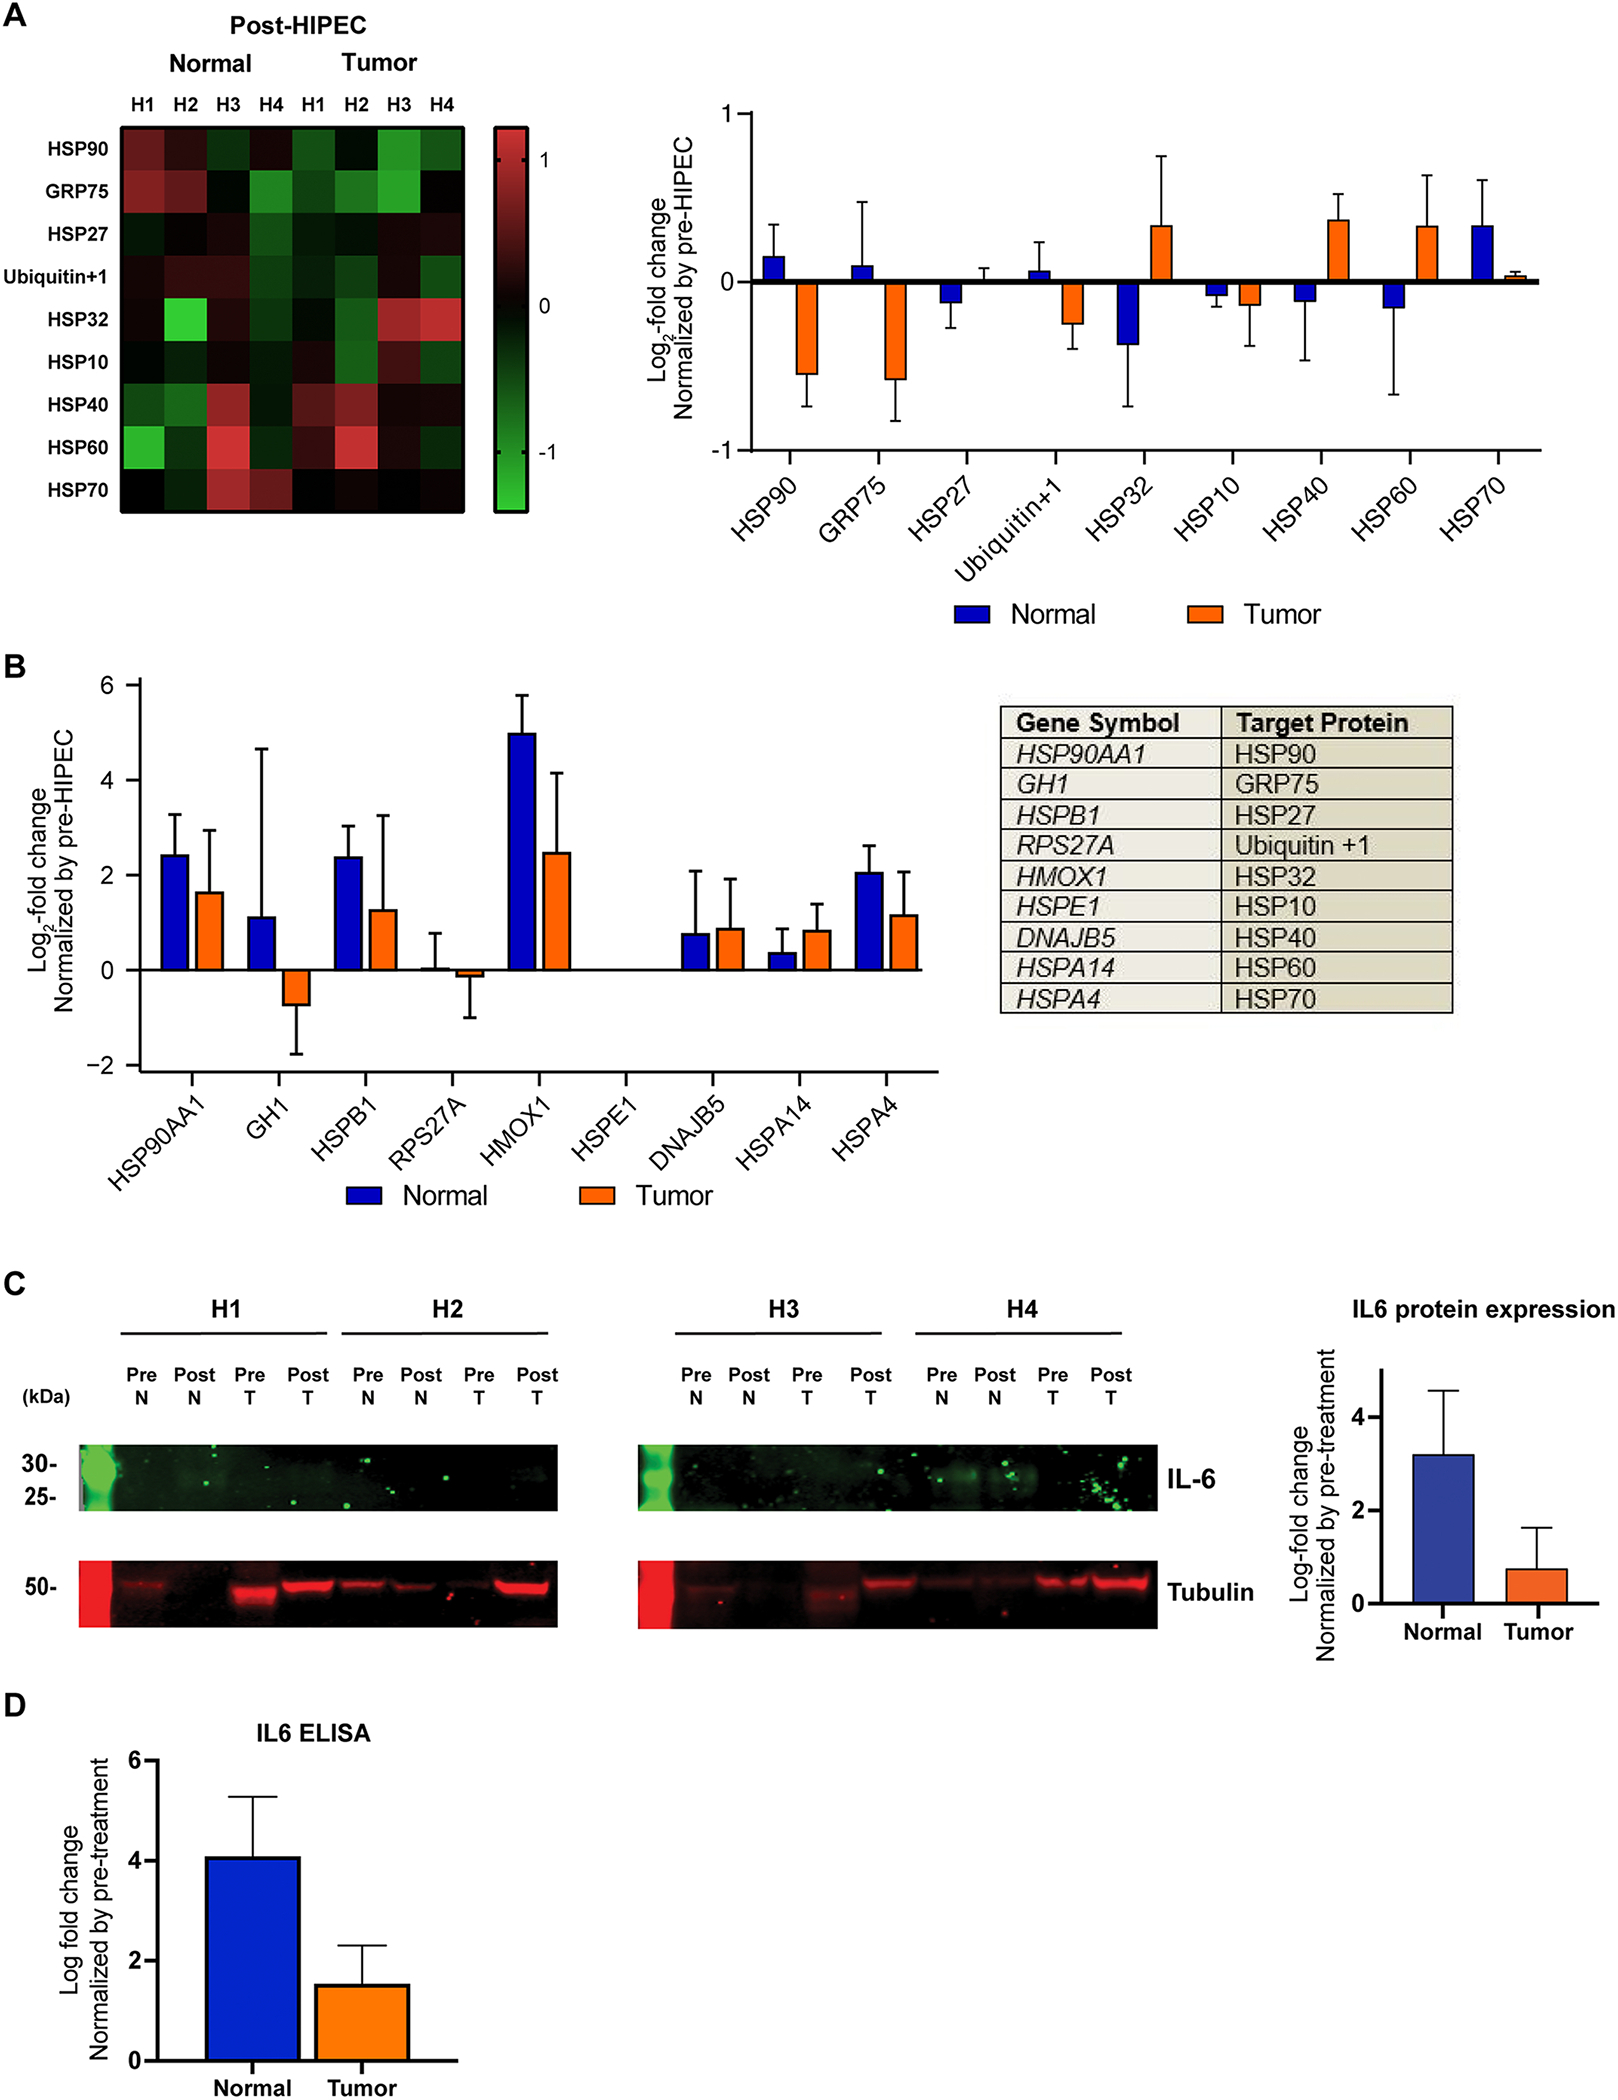
Figure 4: Effects of HIPEC with platinum on heat-shock and immune-related protein expression in normal and tumor tissue.

(A) Heatmap of human heat shock protein antibody array demonstrating changes in protein expression levels of normal and tumor tissue samples after HIPEC with platinum exposure, color-coded according to the legend (left). Following background subtraction, the data were normalized to the positive control signals. For each protein, the mean Log2 fold-change post-HIPEC samples compared to pre-HIPEC samples are shown on the right. Error bars, s.d. of mean.
(B) Gene expression Log2 fold-change normalized by gene expression levels pre-HIPEC exposure (Error bars, s.d. of mean). Genes selected for illustration are those that correspond with the 9 heat shock proteins HSP90, GRP75, HSP27, Ubiquitin+1, HSP32, HSP10, HSP40, HSP60 and HSP70 investigated in the protein antibody array (Table, right).
(C) Western blot analysis of IL-6 protein in normal and tumor samples pre- and post-HIPEC with platinum exposure. Tubulin was used as protein loading control (bottom). Mean of Log2 fold-change of post-HIPEC samples as compared to pre-HIPEC samples (right). Error bars, s.d. of mean. Cases are labeled H1 – H4, for normal and tumor tissues.
(D) ELISA of IL-6 protein in normal and tumor samples pre- and post-HIPEC with platinum exposure. Error bars, s.d. of mean.
