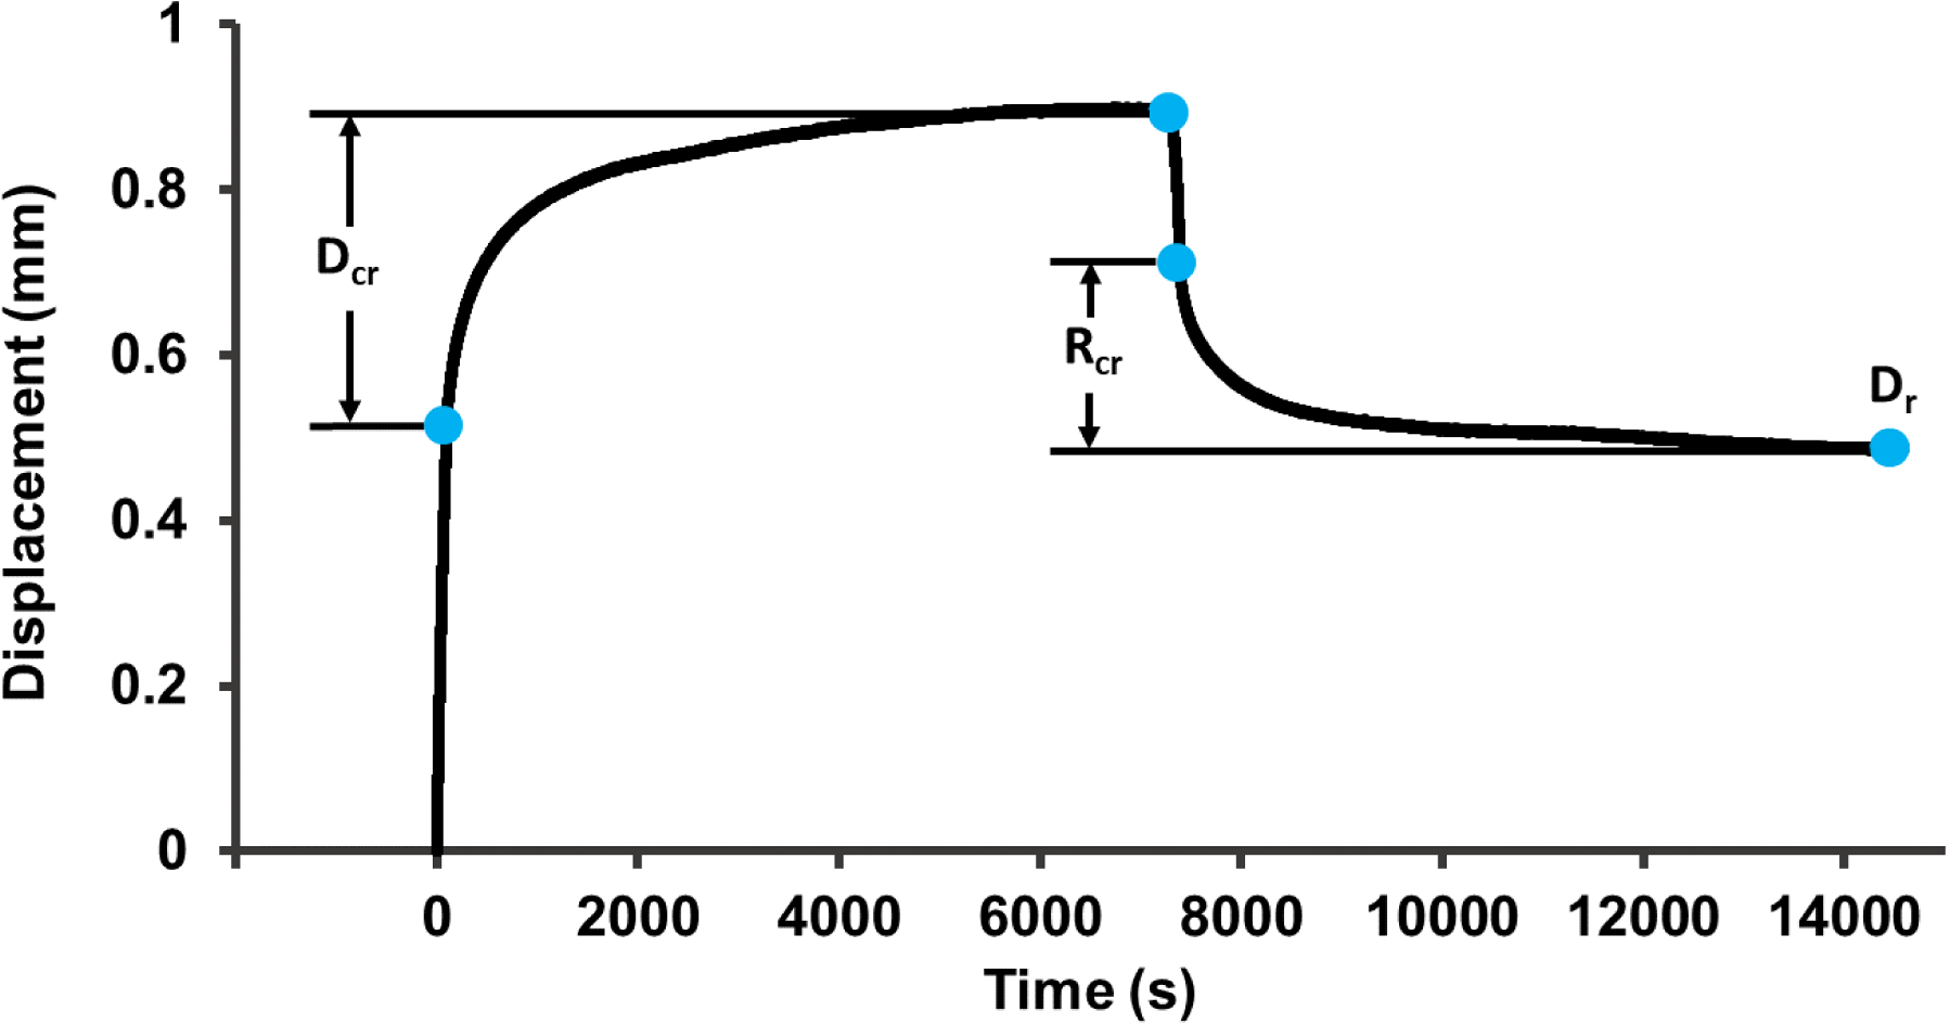
Figure 3:

A representative creep curve (70/F). Creep displacement (Dcr) was calculated as that occurring in the 2 hour hold at 1000 N after initial loading. Recovery from creep (Rcr) was calculated as that occurring during the 2 hour hold at 100 N after elastic recovery. Dcr and Rcr were normalized using the displacement at the start of the 1000 N hold period as alternative outcomes to account for the dependence of these parameters on initial elastic deformation (Dcr-norm and Rcr-norm). Residual displacement (Dr) was calculated as the final displacement after the 2 hour hold at 100 N. Curve fitting was performed on the same data range used to calculate Dcr in order to calculate the creep time constant (τcr), stretch exponent (n), and creep rate (C).
