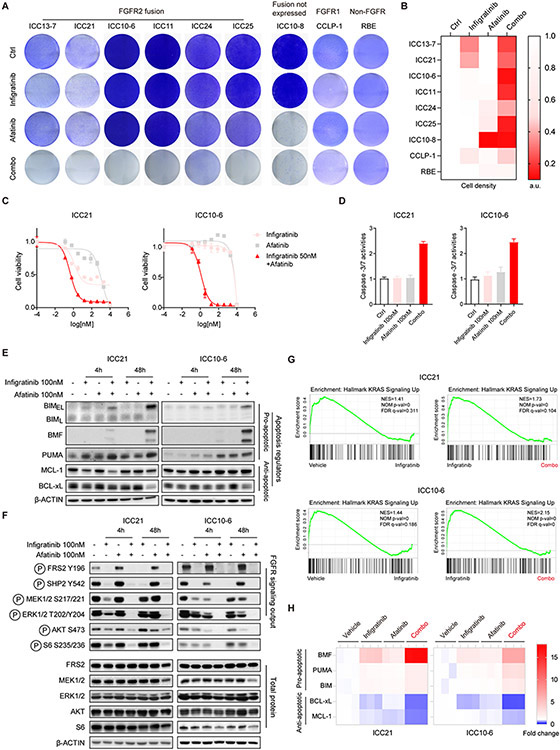
Figure 3. Combined FGFR and EGFR inhibition induces apoptosis and durably inactivates downstream oncogenic signaling in FGFR2 fusion+ ICC cells.
A and B. ICC cell lines were tested for cell viability via crystal violet staining after 7 days (ICC13-7/ICC21) or 10 days treatment (all other cell lines) with single agent infigratinib 100 nM, afatinib 100 nM or the combination or vehicle control. Quantification of cell density from crystal violet staining is shown in (B). a.u. denotes arbitrary unit. C. IC50 assay evaluating the sensitivity of ICC21 (left) and ICC10-6 cells (right) to single agent infigratinib, afatinib or 50 nM infigratinib combined with a range of doses of afatinib. Each point on the dose-response curves represents 2 technical replicates. Data are shown as Mean ± SD. Experiments were repeated at least twice. D. Induction of apoptosis assessed by Caspase-3/7 activity after 3 days treatment with the indicated single agents or combination. Error bars on the graph represent 4 technical replicates. Data are shown as Mean± SD. E, F. FGFR2-fusion+ ICC cell lines were treated with vehicle, 100 nM infigratinib, 100 nM afatinib or the combination for 4 hours or 48 hours, and lysates were subjected to immunoblot analysis for (E) pro-apoptotic (BIM, BMF, PUMA) and anti-apoptotic proteins (MCL-1, BCL-xL) or (F) the indicated signaling proteins. G and H. ICC21 and ICC10-6 cells were treated with vehicle, 100 nM infigratinib, 100 nM afatinib, or the combination for 4 hours and then profiled by RNA sequencing. (G) Pathway enrichment was determined by Gene Set Enrichment Analysis (GSEA). (H) Heatmap showing relative expression changes of apoptosis regulators under different treatment conditions (normalized to vehicle). Only significantly changed genes are shown. Each column shows a biological replicate (3/condition).

