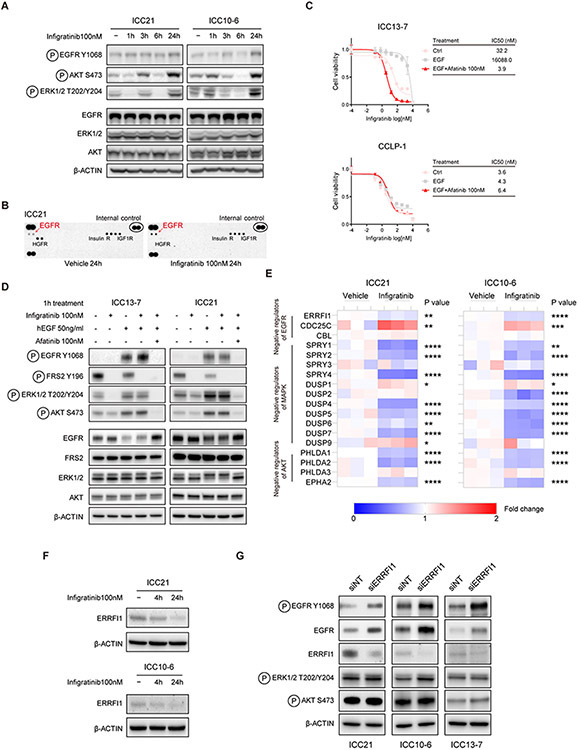
Figure 4. Feedback activation of EGFR signaling limits effectiveness of FGFR inhibition.
A. ICC21 and ICC10-6 cells were treated with 100 nM infigratinib or vehicle for the indicated times and lysates were subjected to immunoblot analysis using antibodies against indicated the proteins. B. Phospho-RTK array analysis of ICC21 cells treated with vehicle or 100 nM infigratinib for 24 hours. C. ICC13-7 and CCLP-1 cells were treated with human EGF (50 ng/ml) and/or afatinib (100 nM), or with vehicle control, and tested for sensitivity to infigratinib (IC50 assay). Each point on the dose-response curves represents 4 technical replicates. Data are shown as Mean ± SD. The charts on the right report the IC50 values. D. Immunoblot analysis of ICC13-7 and ICC21 cells treated for 1 hour with human EGF (50 ng/ml), afatinib (100 nM), and/or infigratinib (100 nM) as indicated. E. RNA-seq analysis of FGFR2-fusion+ ICC models. FGFR2-fusion+ ICC cell lines (ICC21 and ICC10-6 cells) were treated with 100 nM infigratinib or vehicle for 4 hours. The heatmaps show the relative expression of negative regulators of EGFR, RTK/MAPK and PI3K/AKT signaling. Each column shows a biological replicate (3/condition). *P<0.05, **P<0.01, ***P<0.001, ****P<0.0001. F. Immunoblot analysis of ICC21 and ICC10-6 cells treated with vehicle or 100 nM infigratinib for the indicated timepoints. G. FGFR2-fusion+ ICC cell lines (ICC21/ICC10-6/ICC13-7 cells) were transfected with ERRFI1 siRNA or non-targeting control siRNA and then subjected to immunoblot analysis.

