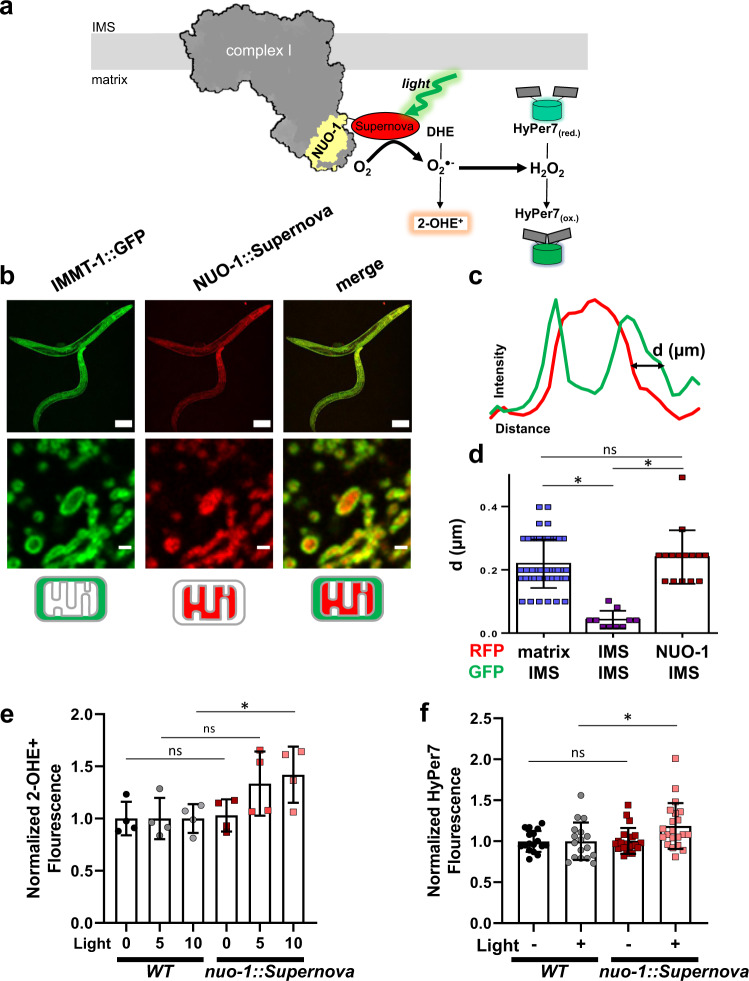
Fig. 2. Optogenetic generation of complex I ROS production.
a Schematic illustration of light-induced complex I ROS generation. CRISPR/Cas9 fused Supernova to flavin mononucleotide (FMN) subunit, nuo-1. Upon illumination Supernova generates superoxide (O2.−) which can be detected by the dihydroethidium (DHE) oxidation product 2-hydroxyethidium (2-OHE+). Superoxide can then dismutate to hydrogen peroxide (H2O2) and is detected by the matrix-targeted biosensor HyPer7. b Localization of NUO-1::Supernova fusion protein. Mitochondrial electron transport chain complexes were tagged with fluorescent proteins. Compartmentalization of the fluorescent protein was assessed using the cristae maintenance protein IMMT tagged with GFP, which is restricted to outer membrane and inner membrane contact sites and not within cristae. Scale bar 100 (top) and 1 µm (bottom). Image is representative of at least three independent experiments. Additional localization data presented in Supplementary Figures. c Line scans of fluorescent protein signals across a mitochondrion. d Quantification of mitochondrial fluorescent protein fusion line scans. SDHB-1::mCherry, SDHC-1::mCherry, and IMMT::GFP are used as standards to characterize NUO-1::Supernova localization and are localized to the matrix, intermembrane space (IMS) and IMS, respectively. Individual line scan NUO-1::Supernova, SDHC-1::mCherry, and SDHB-1::mCherry provided in the Supplementary Figures. Data are mean ± SD. N = 50, 10, 15 independent mitochondria *p < 0.05 (Kruskal-Wallis test, Dunn’s multiple comparisons). e Superoxide detection using 2-OHE+. Mitochondria isolated from wild-type and nuo-1::Supernova worms were illuminated (GYX, 7.8 mW/mm2) for the indicated time, in the presence of dihydroethidium (DHE, 100 µM) for 2-OHE+ separation using HPLC. Data normalized to WT for each condition. Raw data are in Supplementary Fig. 4A, B. Data are mean ± SD. N = 4 independent mitochondrial preparations, *p < 0.05, **p < 0.01 (Two-way ANOVA, Sidak’s multiple comparisons). f Measurement of H2O2 with mitochondrial matrix-targeted HyPer7. L4 wild-type and nuo-1::Supernova worms were screened for bright pharyngeal expression of HyPer7. Worms were placed into glass-bottom 96-well plate containing M9 buffer and illuminated (GYX, 1.44 mW/mm2) for 2 min. HyPer7 intensity ratio (500/400 nm) are normalized to WT for each condition. Raw data are in Supplementary Fig. 4C, D. Data are mean ± SD. N = 17, 17, 21, 21 independent animals across 3 technical replicates, *p < 0.05, **p < 0.01 (Two-way ANOVA, Sidak’s multiple comparisons).

