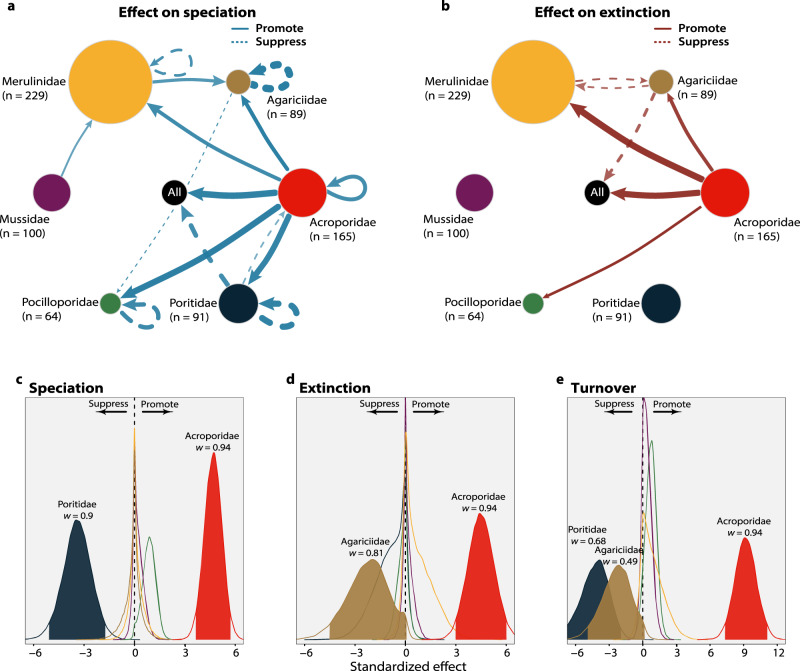
Fig. 3. The overwhelming cross-clade effect of Acroporidae on the diversity of reef corals.
A network depicts the estimated cross-clade influence on rates of speciation (a) and extinction (b). Arrows represent the directionality of interaction effects, while arrow widths are proportional to the estimated median effect. Continuous or dashed lines indicate promoting or suppressing effects, respectively. Only interactions with a strong signal in the model were included (w > 0.7; see Methods). Loops represent self-diversity dependency; i.e., when confamilial species influence their own diversity trajectories. The size of each external node is proportional to the number of fossil occurrences in each family, and the number of fossil species in each family is shown in parenthesis (n). The central node represents all families combined, for which we also show the posterior distribution of effects on speciation (c), extinction (d) and lineage turnover (e; effect on speciation plus effect on extinction). Filled densities represent effects estimated with a strong signal (w > 0.7). The median shrinkage weights (w) are also shown for these families. Acroporidae—red; Agariciidae—brown; Merulinidae—yellow; Mussidae—purple; Pocilloporidae— green; Poritidae—dark blue. Source data are provided as a Source Data file.

