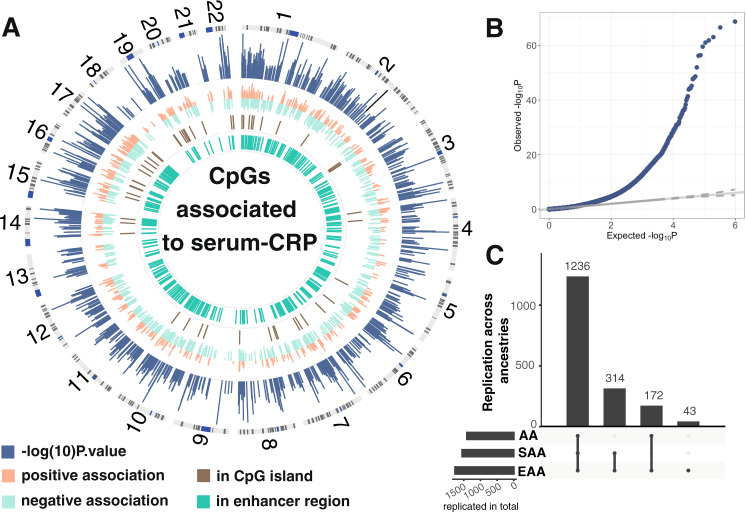
Fig. 1. Results of multi-ethnic meta-analysis.
Panel A is a circos plot representation of the multi-ethnic meta-analysis. Outermost track is chromosome number followed by ideogram. The second track in blue is the Manhattan plot of the CpG CRP association results. Next track (in orange and light green) are effect sizes of CpG CRP associations, where orange represents positive associations and light green negative. Track represented in brown track color gives the overlap between the 1765 CRP associated CpG markers with CpG island in the genome. The innermost track (in dark green) gives the overlap with enhancer regions as defined by Roadmap project23. Panel B is a qqplot of the genomic control corrected P-values from the multi-ethnic meta-analysis. Panel C shows replication rates of 1765 across ancestries. Each bar gives the number of replicated CpGs across ancestries indicated as dots below the barplot. Horizontal bars reflect the total number of replicated CpGs per ancestry group.

