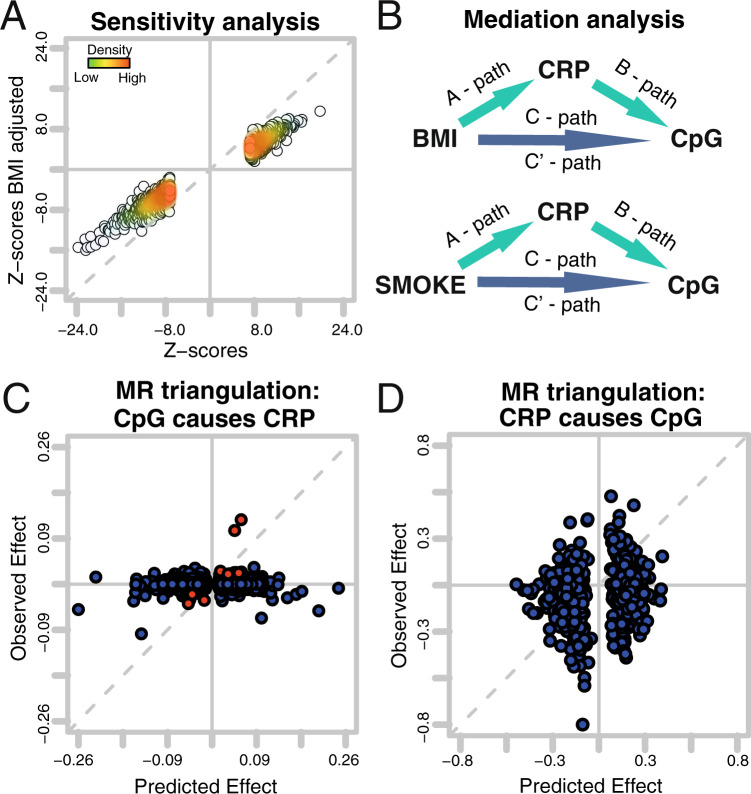
Fig. 3. Driving forces of CpG signature.
Panel A is a comparison of Z-scores from the sensitivity analysis. Each dot represents a coefficient from the 1511 CRP-associated loci. The X-axis gives Z-scores derived from base model as applied in multi-ethnic meta-analysis. The Y-axis gives results from the same analysis adjusted for BMI. Panel B gives an overview of applied mediation analysis models. Panels C and D are representations of the Mendelian Randomization triangulation analysis. Each dot represents a CpG. The Y-axis is the observed effect, which is the association between the genetic instrument and outcome. The observed effects for Panel C originate from CpG instruments (SNPs) vs serum CRP levels. The predicted effect is the combined effect from the SNP CpG association and the CpG serum CRP association. Observed effects for D are the associations between a polygenic risk score for CRP (instruments) and CpG methylation. The predicted effects for panel D are the combined effects from the polygenic risk score for CRP (instruments) serum CRP association and serum CRP CpG methylation association (CRPGenetic risk score for CRP association × CRP CpG association). The observed effect is the association of the polygenic risk score for CRP (instruments) to CpG methylation (CRPGenetic risk score for CpG association).

