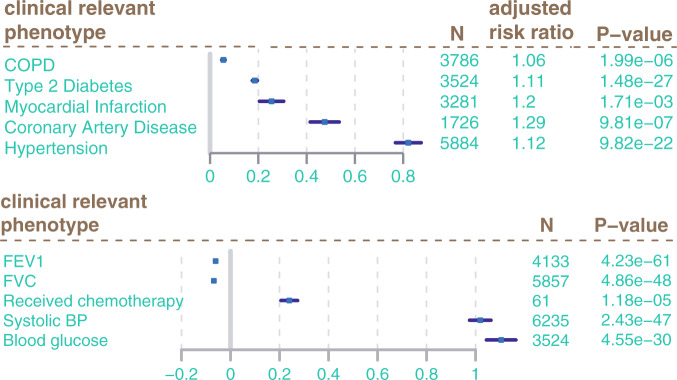
Fig. 5. Associations of CRP DNA methylation signature to clinically relevant phenotypes.
Forest plots give estimate from logistic regression (logODDs) and confidence intervals (error bars) of CpG risk score regression against relevant phenotypes. N is the number of samples included in analysis. To produce adjusted relative risk estimates we transformed odds ratios as follows: RR = odds ratio/1 − (lifetime risk) + (life time risk × odds ratio). Those estimates indicate the theoretical maximum impact of the discovered CpG signature (100% DNA methylation change) on the tested traits. The risk conveyed by one percent change in the DNA methylation risk score on the tested traits was 1.007% for COPD, 1.7% for T2D, 2.9% for myocardial infarction 4.3% coronary artery disease, and 0.2% for hypertension. For continuous traits such as FEV1, FVC, systolic BP, and blood glucose estimates from linear regression including confidence intervals are given.

