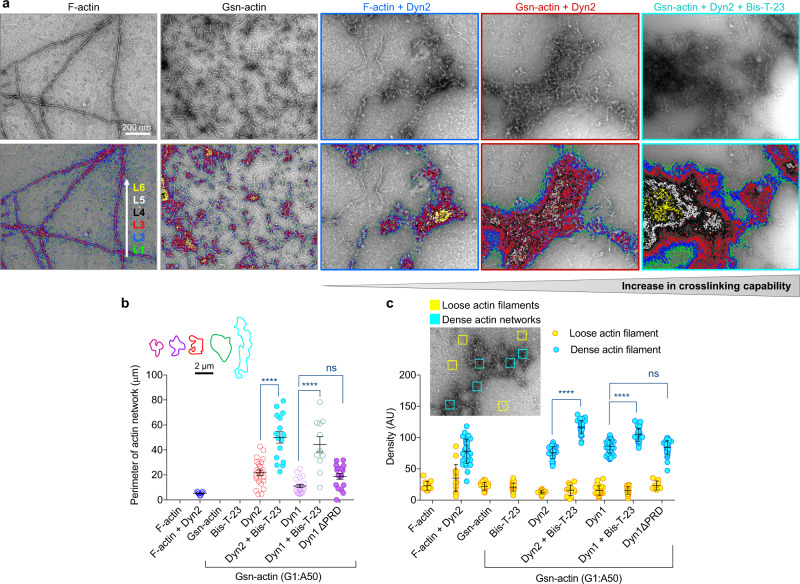
Fig. 3. Dynamin oligomerization status and the length of actin filaments define its cross-linking capability.
a Electron micrograph of actin arrays assembled from F-actin or gelsolin-capped actin filaments (Gsn-actin) by Dyn2 in the presence or absence of Bis-T-23 (0.4 µM). The lower panel shows contour plots depicting density as varying depths within a network. Distinct levels of thickness were color-coded as indicated in the figure. Contour plots were produced based on original EM images in the upper panel. b Bar graph illustrating the size of actin networks shown in (a). The inset shows the representative size (parameter) of actin networks for each condition. 11 to 23 actin networks were analyzed. c Graph depicting the density of the actin filaments incorporated into actin networks (blue) or loosely distributed through the background of the micrograph (yellow). Data were generated by measuring density within a defined square (100 × 100 nm) as shown in the representative insert. Results shown were generated based on EM data shown in (a). 33–45 dense networks (blue squares) and 14–27 loose networks (yellow squares) were counted per condition. Data in (b), (c) are plotted as mean ± S.E.M. and mean ± S.D, respectively (****P < 0.0001, one-way ANOVA with Tukey’s multiple comparison test). ns, not significant.

