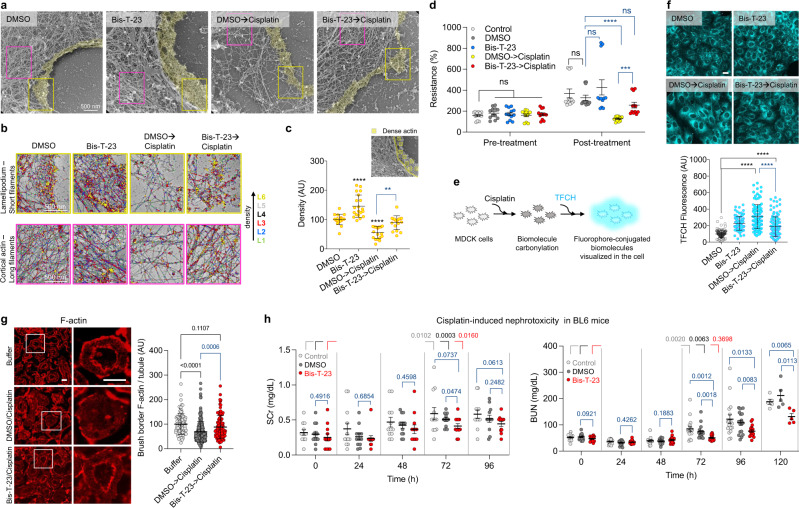
Fig. 4. Dynamin agonist protects renal tubules from cisplatin-induced injury by stabilizing the actomyosin cortex at the apical membrane.
a PR-EM image of lamellipodium in MDCK cells treated with DMSO (0.1%) or Bis-T-23 (5 µM, 0.1% DMSO) for 1 h prior to the addition of cisplatin (35 µM) for 23 h. The actomyosin cortex was colored yellow. b Higher magnification images of boxed regions in (a). Distinct levels of thickness are color-coded. The upper and lower panels show networks formed by shorter filaments and longer filaments, respectively. c Graph depicting the density of the actin filaments at the leading edge (yellow box in (a); 18–20 areas counted). d Bar graph depicting relative transepithelial electrical resistance (%) in live MDCK cells treated as stated in (a) except for cisplatin (50 µM) and Bis-T-23 (30 µM) concentrations (12 readings per sample). Data are plotted as mean ± S.E.M. (***P < 0.001, ****P < 0.0001, unpaired two-tailed t-test). ns, not significant. e Schematic representation of oxidative stress-induced carbonylation detection using TFCH assay. f Images showing the levels of biomolecule carbonyls determined by TFCH. Cells were treated as described in (a) except for cisplatin concentration (5 µM). Scale bar, 20 µm. Graph depicting the relative levels of TFCH fluorescence associated with biomolecule carbonyls per cell (data points (n) = 83–116; each point represents average intensity of 4–9 cells). g Rat kidney slices stained with anti-actin antibody. Kidney slices were incubated in buffer, DMSO (0.1%), or Bis-T-23 (30 µM) for 1 h before adding cisplatin (200 µM) or buffer for 8 h. White squared regions were enlarged. Scale bars, 40 µm. Graph showing F-actin intensity at the brush border per tubule (100-236). For c, f, g, data are plotted as mean ± S.D. (P values are reported in the Figure, one-way ANOVA with Tukey’s multiple comparison test). h Scatter dot plots showing AKI induced by cisplatin determined by the level of blood urea nitrogen (BUN) or serum creatinine (SCr). Animals were injected with either DMSO (1%) or Bis-T-23 (20 mg/kg) (n = 12, per condition for SCr; n = 17, per condition for BUN) once a day starting 24 h prior to cisplatin (15 mg/kg) injection. The measurements were performed at the indicated times. Data are plotted as mean ± S.E.M. (P values are reported in the Figure, unpaired two-tailed t-test). ns, not significant.

