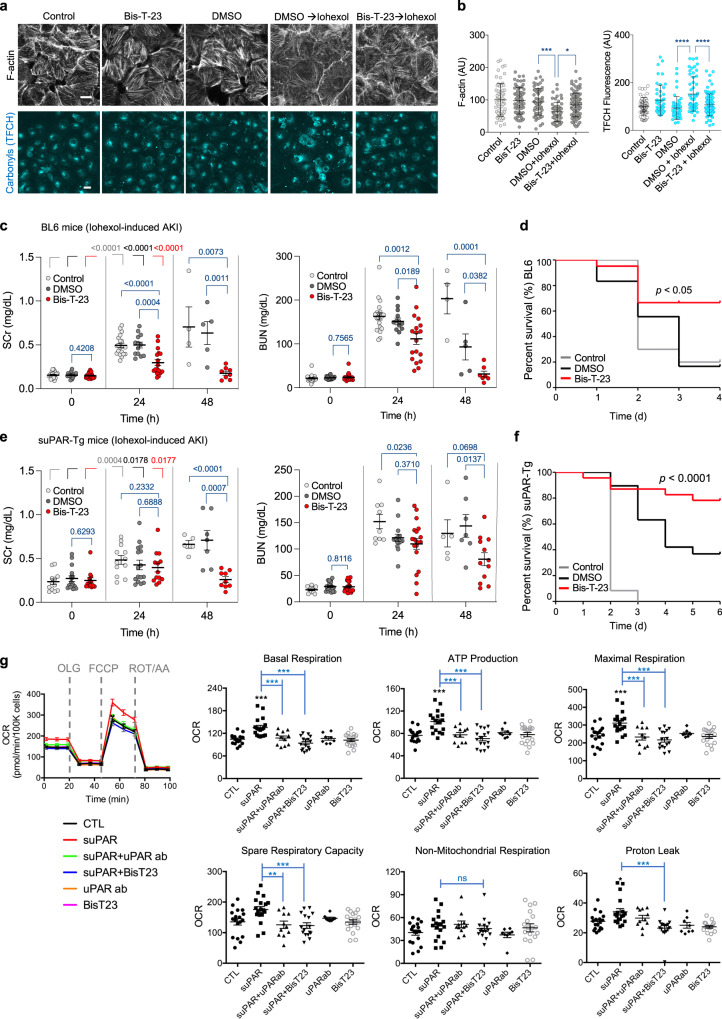
Fig. 5. Dynamin agonist counteracts Iohexol-induced AKI.
a Status of F-actin and biomolecule carbonylation in HK-2 cells. HK-2 cells were treated with medium (Control), DMSO (0.1%), or Bis-T-23 (10 µM, 0.1% DMSO) for 1 h. The medium was replaced with only medium or medium containing Iohexol+DMSO (250 mg/mL (F-actin set) and 100 mg/mL (TFCH assay)) or iohexol+Bis-T-23 for ~3 h. Scale bar, 20 μm. b Graphs depicting the relative levels of F-actin within a fixed region of interest (ROI) in the cells (58–98 ROI analyzed) TFCH fluorescence (cellular biomolecule carbonyls) (data points (n) = 46–83; each point represents average intensity of 1–4 cells). Error bars, mean ± S.D. (*P < 0.05, ***P < 0.001 ****P < 0.0001, one-way ANOVA with Tukey’s multiple comparison test). c, e Scatter dot plots showing AKI induced by Iohexol (5 g/kg) determined by the level of SCr or BUN in BL6 wild-type mice (c, d) or suPAR-Tg mice (e, f). c, e Error bars, mean ± S.E.M. (P values are reported in the Figure, unpaired two-tailed t-test). As indicated, animals were injected with either DMSO (1%) or Bis-T-23 (20 mg/kg) once a day starting at 0 h. The measurements were performed at the indicated times. Number of animals per condition in c: BL6 control (n = 20), DMSO (n = 18), and Bis-T-23 (n = 21). Number of animals per condition in (e): suPAR-Tg control (n = 12 for BUN or SCr), DMSO (n = 19 for BUN; n = 16 for SCr), and Bis-T-23 (n = 20 for BUN; n = 13 for Scr). d, f Log-Rank (Mantel-cox) test was performed to analyze survival curves of animals treated as described in (c), (e). P was calculated using an unpaired two-tailed t-test. g Oxygen consumption rate (OCR) curves and Seahorse XF analyzer measurements of mitochondrial respiration of HK-2 cells. HK-2 cells were treated with suPAR (10 ng/ml), human anti-uPAR antibody (50 ng/ml), or Bis-T-23 (10 µM) alone or in combination for 24 h. OCR was measured in real-time under basal conditions and in response to sequential injections of mitochondrial inhibitors including oligomycin (OLG; an ATP synthase inhibitor), FCCP (an uncoupler of ATP synthesis from oxygen consumption), rotenone (ROT; complex I inhibitor), and antimycin A (AA; complex III inhibitor). Each OCR value was normalized to cell number and is presented as pm/min/100,000 cells. Graphs represent three independent experiments and are derived from the mean values (S.E.M.) of at least 8 replicates per group. Error bars, mean ± S.E.M. (**P < 0.01, ***P < 0.001, one-way ANOVA). ns, not significant.

