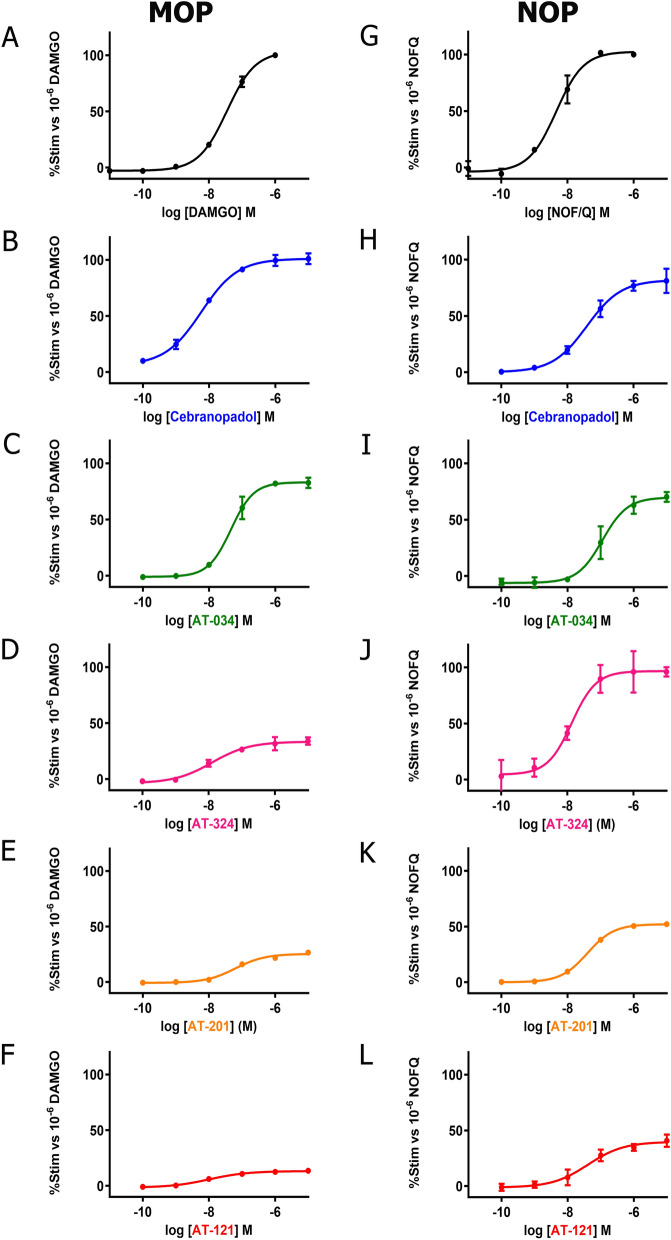
Figure 2.
G protein signaling of novel mixed MOP/NOP agonists measured by GTPƔS assay. Concentration–response curves obtained for prototypical selective agonist DAMGO (A) and N/OFQ (G), novel mixed MOP/NOP agonists cebranopadol (B, H), AT-034 (C, I), AT-324 (D, J), AT-201 (E, K), AT-121 (F, L) at MOP and NOP, respectively, in stably expressing CHO cells. Each data point (mean ± SEM) was calculated from at least three independent experiments conducted in triplicates.

