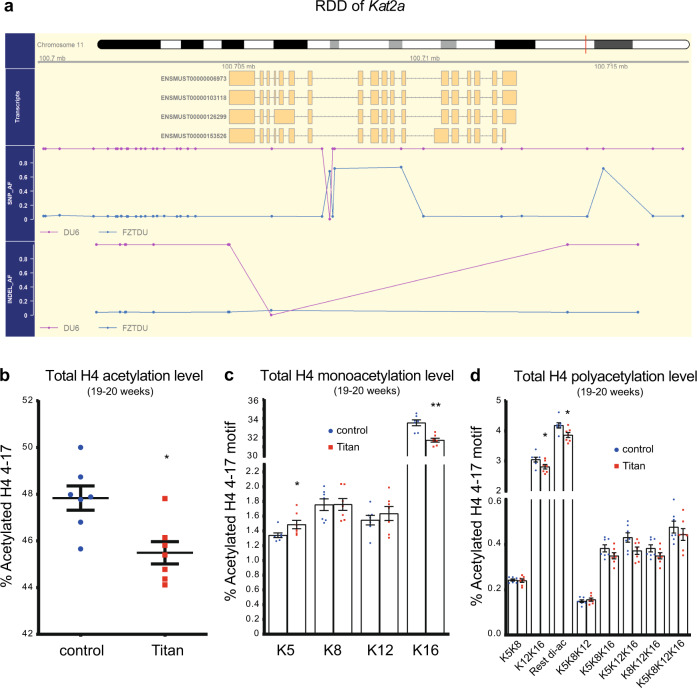
Fig. 2. Histone 4 acetylation levels are altered in Titan compared with unselected control mice.
a Scheme of the regions of distinct genetic differentiation (RDD) of the Kat2a gene in Titan and control mice. b Total levels of histone 4 (H4) 4–17 levels via mass spectrometry (p = 0.0111, MWU-test) (n = 7 per group). c Quantification of monoacetylation of histone 4 4–17. p values, Mann–Whitney U (MWU)-test (H4K5K8) = 0.0175, (H4K8) = 0.901, (H4K12) = 0.455, (H4K16) = 0.0023 (n = 7 per group). d Quantification of polyacetylation of histone 4 4–17. p values, MWU-test (H4K5K8) = 1, (H4K12K16) = 0.0379, (H4-rest di-ac) = 0.0379, (H4K5K8K12) = 0.62, (H4K5K8K16) = 0.208, (H4K5K12K16) = 0.053, (H4K8K12K16) = 0.208, (H4 tetra-ac) = 0.62 (n = 7 per group). *p < 0.05, **p < 0.01. Error bars indicate SEM.

