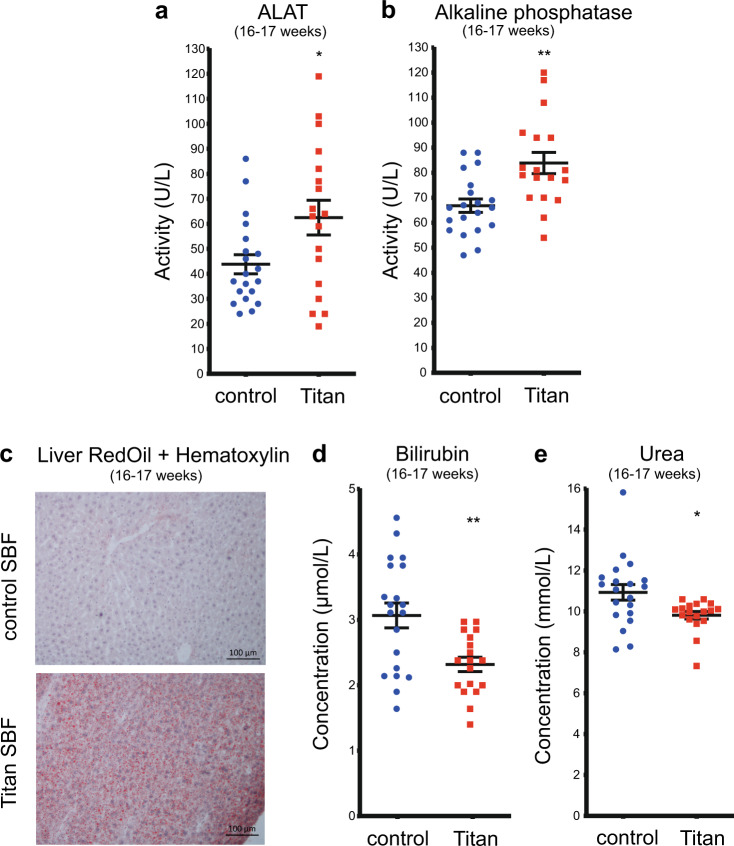
Fig. 4. Titan mice display altered liver metabolism.
a ALAT (p = 0.0262) and (b) ALP (p = 0.0019) levels in control (n = 20) and Titan mice (n = 18). c Oil Red O with hematoxylin staining of fat in liver of control and Titan mice (n = 4 per group). d Bilirubin levels in control (n = 20) and Titan mice (n = 18; p = 0.0019). e Urea levels of control (n = 20) and Titan (n = 18) mice (p = 0.0132). *p < 0.05, **p < 0.01. Unpaired two-tailed t-tests with Welch’s correction were used to calculate p values. Error bars indicate SEM.

