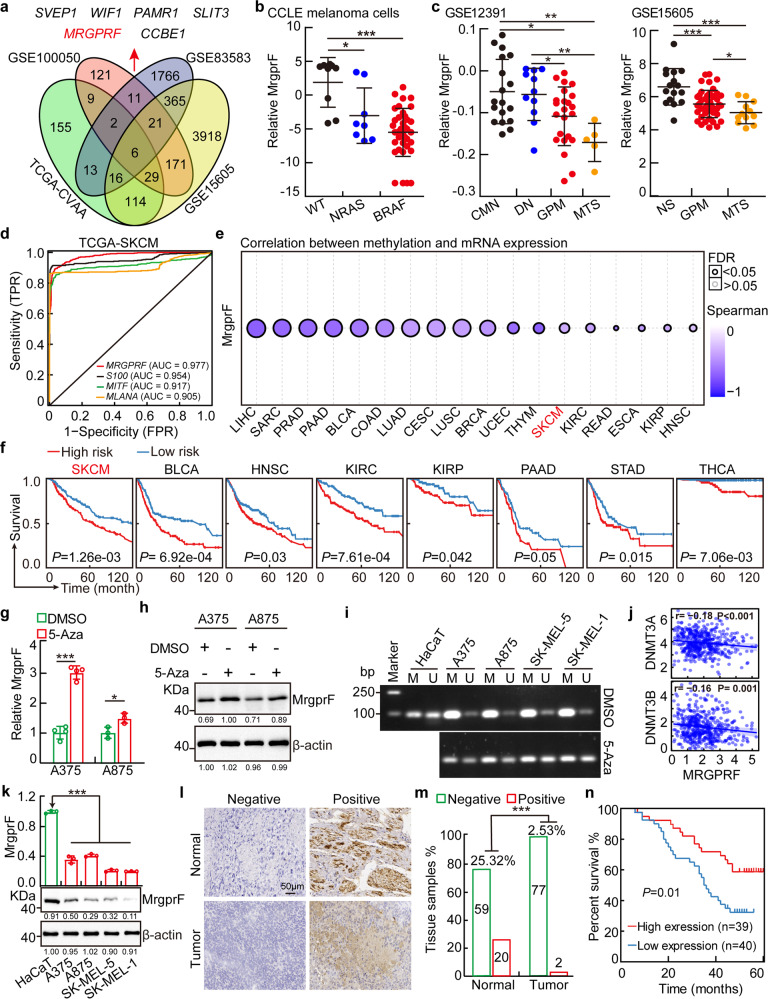
Fig. 1. MrgprF was decreased in melanoma.
a MrgprF was identified by integrative bioinformatics analysis using TCGA-CVAA (pan-cancer deregulated genes, green) dataset and melanoma related GEO datasets, including GSE100050 (red), GSE83583 (blue), and GSE15605 (yellow). Six shared DEGs, including SVEP1, WIF1, PAMR1, SLIT3, MRGPRF, and CCBE1 were identified. b MrgprF was decreased in NRAS and BRAF mutated cell lines examined by the CCLE (the cancer cell line encyclopedia) dataset, NRAS and BRAF wild type cells were used as control. c MrgprF is downregulated in advanced melanoma compared to normal nevi or primary melanoma as analyzed by GSE12391 and GSE15605 datasets. CMN: common melanocytic nevi; DN dysplastic nevi; GPM growth phase melanomas; MTS melanoma metastasis; NS normal skin. d Receiver operating characteristic (ROC) curves for MrgprF, S100, MITF, and MLANA examined by TCGA-melanoma datasets. The AUC (area under the curve) numbers are indicated. e MrgprF mRNA expression level was negatively correlated with its promoter methylation status in melanoma analyzed by the GSCALite database. f High methylation levels in the MrgprF promoter region (high risk) positively correlated with poor survival probability in various types of human cancer, as analyzed by the DNMIVD database in comparison to low risk group. g, h MrgprF expression was examined by Real-time RT-PCR (g) and immunoblot (h) after 5-Azacytidine (5-Aza) treatment. i Methylation-specific PCR (MSP) experiment validating the methylation status of MRGPRF promoter with or without 5-Aza treatment. M: methylated alleles; U: unmethylated alleles. j Correlation analysis between MrgprF and DNMT3A/DNMT3B, using the TCGA-melanoma database. k The relative expression levels of MrgprF in melanoma cell lines including A375, A875, SK-MEL-5, and SK-MEL-1 examined by Real-time RT-PCR and immunoblot. The human immortalized keratinocyte-HaCaT cell line was used as a control. l, m Representative immunohistochemistry (IHC) staining images for MrgprF using a melanoma tissue microarray (TMA) (l). The statistical data for IHC staining was also indicated (m). Scale bar = 50 μm. n MrgprF low expression positively correlates with poor survival rate analyzed by TMA dataset in (l, m). Quantified results for all the immunoblots are indicated below, which are normalized to the β-actin signal, compared to reciprocal control. Bars are the mean value ± SD. *P < 0.05, **P < 0.01, ***P < 0.001

