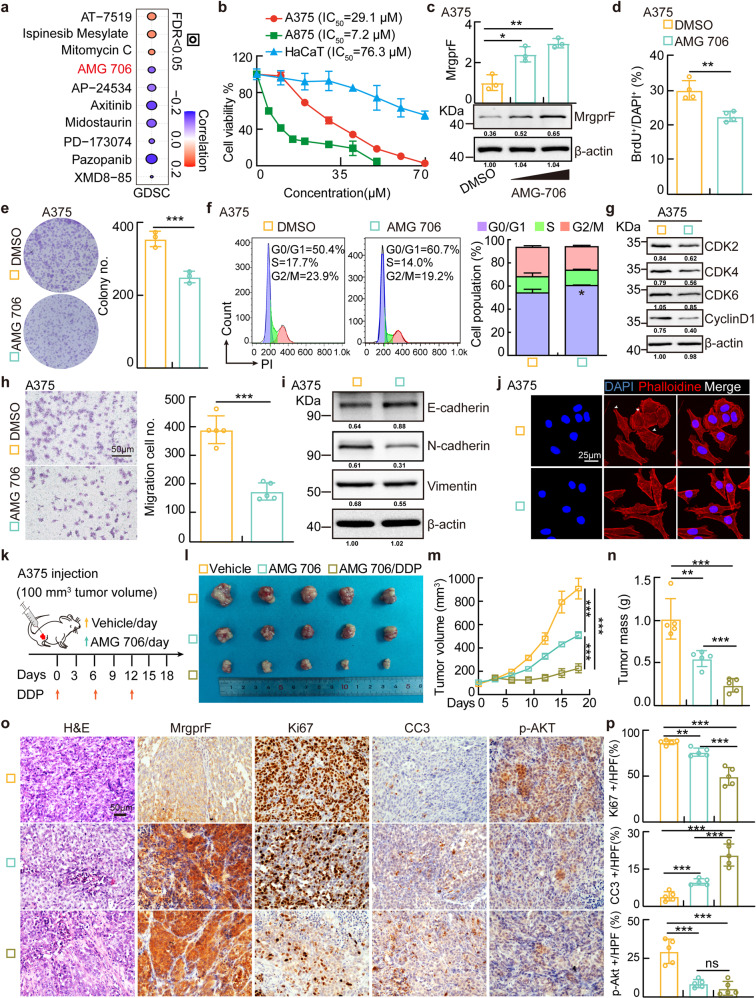
Fig. 5. AMG 706 is a potent MrgprF agonist inhibiting CM progression.
a Pearson correlation analysis was performed between MrgprF mRNA expression and drug IC50 using the GDSC database. Blue bubbles: negative correlations; Red bubbles: positive correlations, the deeper the color is, the higher the correlation is. Bubble size is positively associated with the FDR significance. Black outline border indicates FDR < 0.05. b Cell viabilities following treatment with the indicated concentration of AMG 706 for 48 h were examined by sulforhodamine B (SRB) staining. The IC50 for each cell line is indicated. c AMG 706 (15 and 30 μM) 24 h treatment increased MrgprF expressions examined by Real-time RT-PCR (top) and immunoblot (bottom) in A375 cells. d, e AMG 706 (15 μM) treatment in A375 cells decreased cell proliferation as examined by BrdU incorporation (d) and colony formation (e) assays. Quantification data are shown. f, g AMG 706 (15 μM) treatment in A375 cells promoted G0/G1 phase arrested cell population as examined by FACS (f) and immunoblot (g). Indicated cell lysates were probed with the indicated antibodies. Quantification data is shown. h, i AMG 706 (15 μM) treatment in A375 cells suppressed cell migration as examined by trans-well (h) and immunoblot (i). Indicated cell lysates were probed with indicated antibodies. Quantification data is shown. Scale bar = 50 μm. j Immunofluorescence staining of Phalloidine in A375 treated with DMSO or AMG 706 (15 μM). White head arrows pointing to the pseudopodia like structure. Scale bar = 25 μm. k Schematic view of xenograft mouse model treated by indicated drugs. (l-n) AMG 706 inhibited xenograft tumor growth in vivo with AMG 706 (7.5 mg/kg) or/and DDP (7 mg/kg) treatments. Representative xenograft tumor images (l), tumor volumes (m, data are presented as mean ± SEM) and tumor masses (n) are shown for the indicated mouse groups. A375 cells were used. o, p Representative IHC staining of MrgprF, Ki67, CC3, and p-Akt in indicated xenograft tumors. p Quantification data for (o). Scale bar = 50 μm. Quantified results for all the immunoblots are indicated below, which are normalized to the β-actin signal, compared to reciprocal control. Bars are the mean value ± SD. *P < 0.05, **P < 0.01, ***P < 0.001

