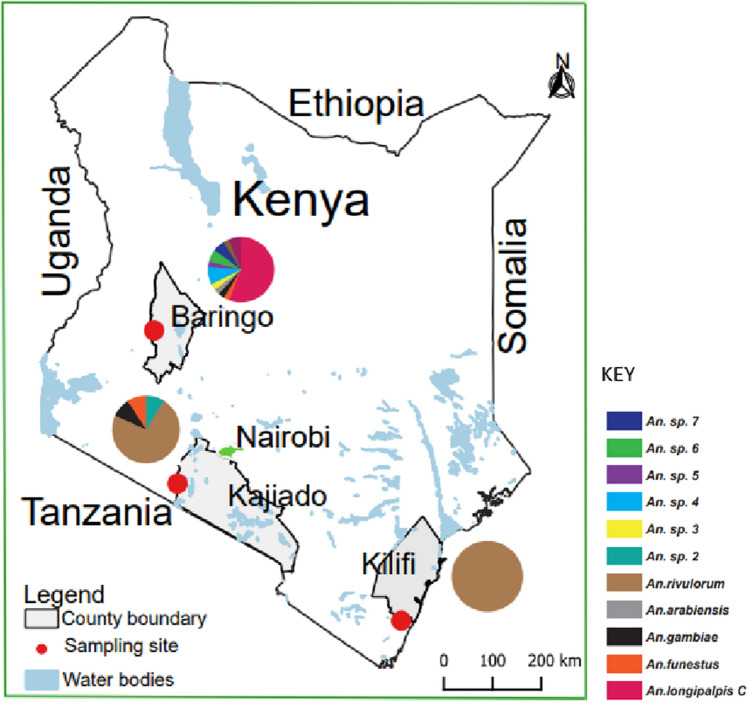
Figure 1.
Map of Kenya showing the study areas and distribution of anopheline species found infected with Plasmodium falciparum sporozoites. Pie-chart indicating the relative abundance of the species infected based on actual numbers is shown for each study area. The map was designed using ArcMap 10.2.2 with the ocean and lakes base layer derived from Natural Earth (http://www.naturalearthdata.com/, a free GIS data source). The sample points were collected using a GPS gadget (garmin etrex 20, https://buy.garmin.com/en-US/US/p/518046), and the county boundaries for Kenya derived from Africa Open data (https://africaopendata.org/dataset/kenya-counties-shapefile, license Creative Commons).

