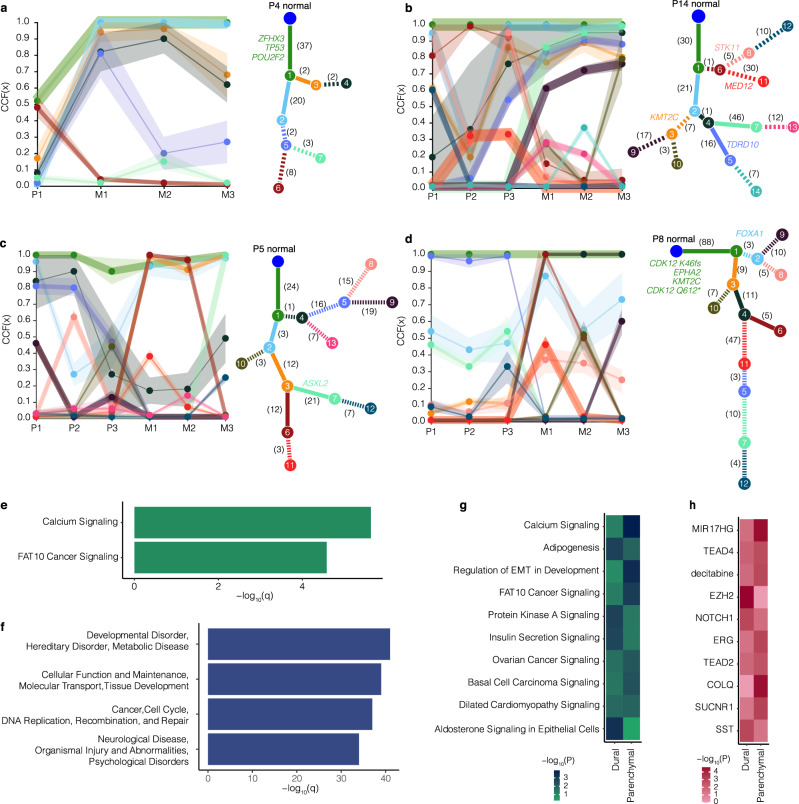
Fig. 3. Clonal evolution in PCBM Clonal evolution in four patients from the PCBM cohort.
Patients P4 (a) and P14 (b) had dural metastases, and patients P5 (c) and P8 (d) had parenchymal metastases. Trace plots show cancer cell fraction (CCF) for each mutational cluster in each patient sample (P = primary, M = metastasis). Ribbons show 95% confidence interval, center of bands show mean cluster CCF estimate. Phylogenetic trees show best solution for evolutionary relationship between clones with different clusters of mutations where each node (numbered) is a cluster of mutations. Numbers on each branch show the number of mutations distinguishing a clone from the previous (all genes). Potential driver genes mutated in the distinction between a clone and the previous are indicated in colors corresponding to the branch. Solid branches show clusters of mutations which become clonal in metastatic samples. e Enrichment for canonical pathways associated with genes in mutational clusters, that expand from subclonal in primary samples to clonal in at least one metastatic sample from all 20 patients with primary and metastatic samples calculated using Ingenuity Pathway Analysis. f As for e but showing enrichment for gene networks associated with metastatic-clonal genes. g As for e but with metastatic-clonal genes in dural and parenchymal metastases analyzed separately. h As for g but examining gene sets defined by their upstream regulator. Enrichment was calculated using two-sided Fisher’s exact test. Plotted P-values are unadjusted. Source data are provided as a Source Data file.

