Abstract
Despite previous studies on exploring the environmental effects of titanium dioxide nanoparticles particle (nTiO2) on plants, the detailed impacts of nTiO2 on the antioxidant system and photosynthesis of plants is still not well understood. This study was aimed at investigating the physiological and biochemical responses to nTiO2 by oxidative damage, Ti bioaccumulation, cell death, and photosynthesis in wheat. The results showed that 5.0 g nTiO2 L−1 resulted in a significant decrease in plant growth, chlorophyll contents, and photosynthetic activity. However, the obvious accumulation of reactive oxygen species (ROS) and cell death were observed under nTiO2 treatments in wheat roots and leaves. In addition, the concentrations of Ti in the roots were significantly higher than that in leaves with increased nTiO2 concentrations. Significant increase in enzyme activities and the levels of ascorbate were found in leaves exposed to 1.0 and 5.0 g nTiO2 L−1. Furthermore, the level of D1 and PsbS remarkably decreased in wheat leaves at 5.0 g nTiO2 L−1. However, the strong phosphorylation of photosystem II (PSII) reaction center protein D1 and D2 was observed at 5.0 g nTiO2 L−1. Altogether, these findings demonstrated that the roots suffered from more severe toxic damage from nTiO2 than the leaves and wheat plants respond to nTiO2 through the different physiological and biochemical mechanisms in the roots and leaves.
Despite previous studies on exploring the environmental effects of titanium dioxide nanoparticles particle (nTiO2) on plants, the detailed impacts of nTiO2 on the antioxidant system and photosynthesis of plants is still not well understood.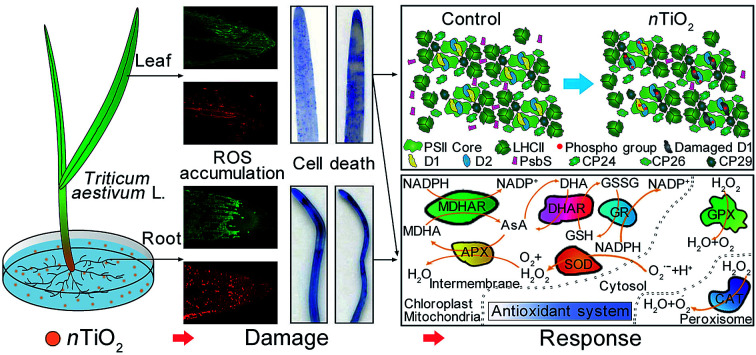
1. Introduction
In recent years, nanotechnology is rapidly developing and affects many aspects of life.1–3 Nanoparticles (NPs) are materials between 1 and 100 nm in size and mainly contain two varieties: natural NPs and manmade NPs (engineered nanoparticles, ENPs), which are carbon-based or metal-based types. Metal-based are grouped in metals, metal oxides, and quantum dots.4–6 ENPs have been used widely in medical, agricultural and industrial products, which usually lead to the excessive accumulation of ENPs in the environment. Titanium dioxide nanoparticles particle (nTiO2) are the most produced and used metal-based ENPs with about 10 000 t per year and widely used in suntan lotions, coatings, new energy and so on.7–9 This intensive application and disposal of nTiO2 and nTiO2 containing products may result in release of nTiO2 in the subsurface environments.10,11 Therefore, there are increasing concerns on the toxic effects caused by nTiO2 in the world. Many evidences have indicated that nTiO2 are toxic to animals, plants, and microbes, and may cause damages to ecosystems and food chain.12–14 Therefore, it is necessary to investigate the toxic roles or mechanism of nTiO2 in plants.
Many studies have shown that ENPs may result in the changes in plant growth, the activities of antioxidant enzymes, oxidative damage, DNA expressions, and photosynthetic activity in many plants.15–18 nTiO2 were also shown to affect plant growth and lead to oxidative stress in plants. Wang et al. reported that nTiO2 caused obvious toxic impact by increasing in the lipid peroxidation.1,15 In addition, a recent study showed that high concentration of nTiO2 increase significantly the content of H2O2 and subsequently induced the generation of reactive oxygen species (ROS),19 which will cause the oxidative damage to plant tissues. However, plants protect themselves from ROS attacking by an efficient antioxidant defense system including antioxidant enzymes and antioxidants under environmental stresses. Some previous studies indicated that the activities of several antioxidant enzymes increased and thus protected the chloroplast structure from ROS under rutile nano-TiO2.20 In addition, Li et al. noted that the disruption of antioxidant system and free radical should be the mechanism of inhibition of Gymnodinium breve growth.21 Although some reports have demonstrated that nTiO2 can lead to ROS accumulation and increase in antioxidant enzyme activities in plants, a comprehensive picture on the relations among ROS, cell death, Ti accumulation and translocation, and antioxidant system under nTiO2 treatments is still not well understood. Therefore, physiological and biochemical mechanism by nTiO2 induces the oxidative damage needs further investigation and elucidation.
Photosynthesis a fundamental process for energy transfer and life on earth and mainly contains photosystem I (PSI) and PSII, which is a large pigment protein complex in cyanobacteria, algae and plants.22 Under environmental stresses including NPs, PSII is regarded to be the most sensitive site where damage is incurred in photosynthesis of plants.23,24 Many studies have suggested that nTiO2 decreased photosynthesis mainly including the decrease of chlorophyll content and net photosynthetic rate (Pn) in plants.16,25 However, some previous studies reported that TiO2 NPs may promote the genetic expression of light-harvesting complex II (LHCII) b in Arabidopsis thaliana, affect the microenvironment of PSII, improve the light absorption of chloroplast, and accelerate the energy transformation.25,26 However, the detailed pathway of the interactions between nTiO2 and thylakoid membrane proteins including PSII protein phosphorylation and PSI is still unknown in plants.
Although some researches show that nTiO2 may promote the germination of seeds, improve photosynthesis, and increase the activity of Rubisco activase activity and nitrate reductase,16,27–29 the toxicity of nTiO2 should depend on the treated concentrations in plants. Therefore, the main goals of the present study were to evaluate the nTiO2 uptake and distribution, and explore the detailed physiological and biochemical regulation in the cell death, antioxidant responses, and photosynthesis in wheat roots and leaves under nTiO2 stress. Our results hereby suggested that different responses and damage were occurred in the roots and leaves due to the accumulated differences of nTiO2. Moreover, the data obtained from immunoblotting supports that PSII proteins and protein phosphorylation are associated with the regulation in toxicity of nTiO2. To our knowledge, this study is the first to explore systematically the toxic effects of nTiO2 on antioxidant system and photosystems in wheat.
2. Materials and methods
2.1. Plant material and treatments
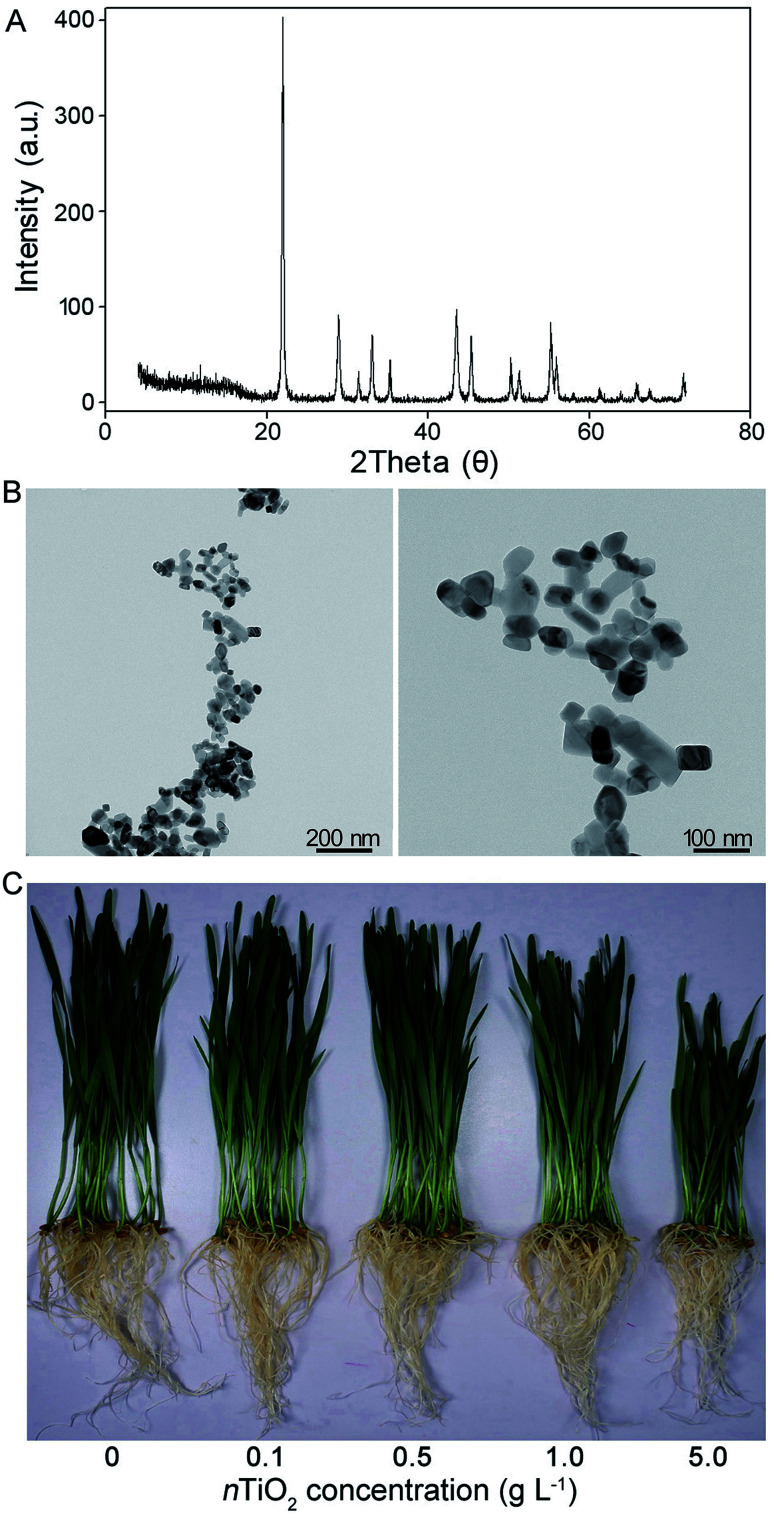
TiO2 nanoparticles were purchased from Sigma-Aldrich Co. The particle size was less than 25 nm with more than 99.5% purity. X-ray diffraction (XRD, AXIS Ultra DLD, Kratos Ltd., British) and transmission electron microscopy (TEM) were used for the characterization of nTiO2 (Fig. 1A and B). The nTiO2 suspensions were prepared through ultrasonic vibration for 1 h with a solution containing 0, 0.1, 0.5, 1.0, or 5.0 g TiO2 power in 100 mL Millipore water (MW) at 25 °C. After sonication, the fresh nTiO2 suspensions were characterized immediately.
Fig. 1. X-ray diffraction (XRD) pattern (A) and transmission electron microscopy (TEM) image (B) of nTiO2 and photos (C) of CN19 exposed to nTiO2 suspensions for 14 days.
Standard seeds of wheat (Triticum aestivum L. Chuannong 19 cultivar) were sterilized for 10 min in 1% (m/v) NaClO solution and washed several times with MW before application. To investigate the effects of nTiO2 on seed germination and growth, the sterilized seeds were placed in Petri dishes (100 mm diameter × 15 mm depth) containing 10 mL nTiO2 suspension at different concentrations of 0, 0.1, 0.5, 1.0, and 5.0 g L−1. The concentrations used in the experiment are chosen according to the previous research.30 A number of 30 seeds were sowed in each Petri dishes and then germinated for 2 days (dark condition) at room temperature in a growth chamber with illumination of 250 μmol photon m−2 s−1 for 16 h day/8 h night cycle, 25/20 °C day/night temperature and 75% relative humidity. The germination rate of wheat was calculated when 80% of control roots were 5 mm long. For other measurements, ungerminated seeds were removed and then 10 mL of nTiO2 suspension was added to each Petri dish. The control plants were only watered. All seedlings were kept for 14 days under the same experimental conditions used for the germination investigation above. After 14 days, the seedlings were harvested and washed thoroughly with MW. Root length and seedling length were measured following the previous method.31
2.2. Determination of Ti contents
After nTiO2 exposure for 14 days, wheat roots and leaves were separated and thoroughly washed with distilled deionized water for several times. Then, these samples were oven-dried for 48 h at 75 °C until weight did not change. The dried plant tissue were placed in a solution 68% HNO3 and 30% H2O2 (2 : 1, v/v) in digestion vessels overnight at room temperature, and then were digested with a microwave digestion system (Ethos 900, Milestone Srl. Sorisole, Italy) for 30 minutes. The contents of Ti were determined using inductively coupled plasma mass spectrometry (ICP-MS, Optimal 2100DV, PerkinElmer Instruments, Waltham, MA, USA).
2.3. In vivo detection of ROS
The visualization of superoxide radicals (O2˙ˉ) in the roots and leaves were performed by incubating the samples with the fluorescence probe 10 mM dihydroethidium (DHE, Sigma) for 30 min according to the previous method.32 Hydrogen peroxide (H2O2) accumulation was monitored by incubation the samples with 25 mM 2,7-dichlorofluorescin diacetate (DCFH-DA, Sigma) for 40 min in the dark according to previous method.33 Then, the in vivo imaging of O2˙ˉ and H2O2 was visualized with a confocal laser scanning microscopy under different wavelengths (O2˙ˉ for excitation at 485 nm, emission at 530 nm; H2O2 for excitation at 488 nm, emission at 520 nm).
2.4. Propidium iodide (PI) and 4,6-diamidino-2-phenylindole (DAPI) staining
To evaluate the degree of cell death under nTiO2 exposure, the roots were immersed in 2 μg mL−1 PI (Sigma) solution for 2 min at room temperature and then rinsed for several times with PBS buffer. The staining was observed immediately with fluorescence microscope (BX-53 System, Olympus Corporation, Tokyo, Japan) with an excitation wavelength of 546 nm. For DAPI staining, the roots were immersed in 1 μg mL−1 DAPI (Sigma) solution for 10 min at room temperature in the dark and then washed for several times with PBS buffer. The imaging of DAPI was visualized using the confocal laser scanning microscope (excitation, 345 nm; emission, 455 nm).
2.5. Chlorophyll fluorescence and P700 parameters
Chlorophyll fluorescence was imaged via an imaging fluorometer named PAM M-Series Chlorophyll Fluorescence System (Heinz-Walz Instruments, Effeltrich, Germany) as described by manufacturer. Wheat plants were putted in dark for at least 30 min prior to the measurements. Actinic light intensity was at an irradiance of 1200 μmol m−2 s−1, and saturated pulse intensity was at 8000 μmol m−2 s−1. Then, the maximum efficiency of PSII photochemistry (Fv/Fm), the photochemical quenching (qP), the quantum yield of PSII electron transport (ΦPSII) and the quantum yield of non-regulated energy dissipation Y(NO) values were calculated based on a previous study.34 The representative image data were normalized to a false color scale.
State transition measurement was carried out with wheat leaves as described previously.35 A blue light (40 μmol m−2 s−1) was applied for preferential PSII excitation. A customized 482 LED light source (SL 3500-R-D) was used for red/far-red light treatment in wheat as described previously.36 Fm level in state I (Fm′) and state II (Fm′′) was obtained by the application of a saturating light pulse at the end of each cycle.
Chl a fluorescence and PSI parameters were measured with a Dual PAM-100 fluorometer (Heinz-Walz Instruments, Effeltrich, Germany) as described previously. PSI parameters including the maximal P700 signal (Pm), the effective quantum yield of PSI (ΦPSI), reduction status of PSI acceptor side (ΦNA), and oxidation status of PSI donor side (ΦND) were determined following the previous method.37
2.6. Isolation of thylakoid and thylakoid membrane protein analyses
Functional thylakoid membranes were isolated under dim light as previously described from fresh or frozen material in liquid nitrogen.38 NaF (10 mM) was included in the extraction buffers to inhibit phosphatase activity. Chl concentrations were determined after extraction with 80% (v/v) acetone as described previously.39 SDS-PAGE (6% stacked gel + 14% separation gel + 6 M urea) with Tris–Gly buffer system was used for separating thylakoid proteins and subsequently transferred to the PVDF membrane (Immobilone, Millipore, Darmstadt, Germany).40 Then, thylakoid proteins were detected by specific antibodies including Lhca1-4, PsaD, PsbS, D1, D2, CP43, and Lhcb1-6 purchased from Agrisera Comp. (Umea, Sweden). The anti-phospho-threonine antibody (Cell Signaling, Ipswich, MA, USA) was applied for detection of phosphoproteins. Loading was determined via Coomassie Brilliant Blue staining before western blotting. The detection of the immunoreaction was performed using a chemiluminescent detection system (ECL, GE Healthcare, Buckinghamshire, UK). Quantification of the immunoblots of thylakoid proteins was carried out with Quantity One software (Bio-Rad Comp. Hercules, CA, USA).
2.7. Transmission electron microscopy analysis of roots and leaves
Structure of wheat roots and leaves after two-week exposure at 5 g nTiO2 L−1 was observed using a transmission electron microscope (TEM H-9500, Hitachi, Tokyo, Japan) operating at 75 kV. The root tips and leaves were prefixed with 0.1 M sodium cacodylate buffer (pH 6.9) containing 3% glutaraldehyde at 4 °C overnight, and then fixed in 1% osmium tetroxide for 1 h. The specimens were subsequently dehydrated with acetone and embedded in Epon 812. Thin sections were cut using an ultra-thin microtome (Ultracut F-701704, Reichert Jung, Reichert, Austria) and then were stained with 2% uranyl acetate on a copper-coated copper grid with glow discharge.
2.8. Statistical analysis
Data were presented as mean ± SD (standard deviation) and analyzed by the Duncan's multiple range test suing the statistical software SPSS 19.0 (IBM, Chicago, IL). The least significant differences were considered significant at P < 0.05 level.
3. Results and discussion
3.1. Plant growth, germination rate, chlorophyll, total protein, soluble sugar, and proline
It is well known that nTiO2 has different effects on the growth, development, and photosynthesis of plants.41,42 In the present study, when compared with the control plants, the phenotype at 0.1 and 0.5 g nTiO2 L−1 concentration did not change, while 1.0 and 5.0 g nTiO2 L−1 concentration inhibited obviously the seedling growth (Fig. 1C). These results were further identified by the data from roots and seedling length, which significantly decreased at 1.0 and 5.0 g nTiO2 L−1 (Table S1†). Previous studies indicated that high concentration of nTiO2 could have induced toxicity in the seed germination and seedling growth.30,41,43 Consistent with findings, our results showed that nTiO2 (1.0 and 5.0 g L−1) caused marked reduction in the germination rate compared with the control, especially for 5.0 g nTiO2 L−1. A previous research showed that chlorophyll could be a more useful indicator of NPs toxicity compared with growth parameters.17 In the present study, the content of chlorophyll and total protein significantly decreased by 26.5% and 11.5% at nTiO2 L−1 at 5.0 g L−1 relative to the control (Table S1†), respectively. Furthermore, the levels of proline and soluble sugar in the roots and leaves were presented in Fig. S1† at different concentrations of nTiO2. Compared with the control, nTiO2 exposure resulted in the significant increase in the contents of proline and soluble sugar, especially for high concentration (5.0 g L−1) of nTiO2 in the roots. Proline and soluble sugar, as two important substances for osmotic adjustment, usually increase in response to stressful conditions in plants.44 The high levels of proline and soluble sugar in the roots relative to the leaves were probably because high concentration of nTiO2 caused the severe oxidative damage to wheat roots. Therefore, these physiological results seemed to suggest that high concentration of nTiO2 likely caused the severe toxicity to wheat seedlings.
3.2. nTiO2-induced oxidative damage
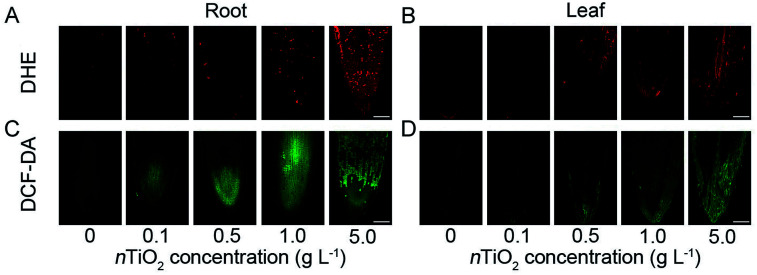
Under environmental stresses including NPs, a large number of reactive oxygen species (ROS) is produced in different organisms as by-products of natural cell functions and subsequently induce the oxidative damage.17,45 To investigate the oxidative damage caused by different concentrations of nTiO2, the levels of the two major ROS species including H2O2 and O2˙ˉ were measured in the roots and leaves. ROS imaging of wheat roots and leaves using specific fluorescent probes showed that more red or green fluorescence was observed at different concentrations of nTiO2 compared with the control, particularly 5 g nTiO2 L−1 (Fig. 2). In addition, a higher ROS accumulation was observed in wheat roots relative to the leaves, indicating that nTiO2 resulted in severe oxidative damage to wheat roots. The results were further identified by histochemical staining of ROS via NBT and DAB (Fig. S2A and B†). To confirm these results, the rate of O2˙ˉ production and H2O2 content was assayed in the roots and leaves under nTiO2 exposure (Fig. S3A–D†). Compared with the control, 1.0 and 5.0 g nTiO2 L−1 significantly increased the content of O2˙ˉ and H2O2 in the roots and leaves. Similarly, the concentrations of O2˙ˉ and H2O2 in the roots were higher than that in the leaves under nTiO2 exposure, especially for high concentration of nTiO2. Although some evidences have indicated that some NPs possess a ROS scavenging property and may cause a protective cellular response in animal cells,46 many other studies have shown that many NPs can induce the accumulation of ROS and subsequently an oxidative stress-mediated necrosis in the roots of plants.47–49 It was probably main reason for high ROS levels in wheat roots in the present experiment. It has been known that over-generation of ROS can lead to the lipid peroxidation, which subsequently results in the damage to cell membrane and oxidative stress.50 In the present experiment, the oxidative stress was further studied by measuring the level of MDA and electrolyte leakage. As shown in Fig. S3E–H,† nTiO2 treatment markedly increased the MDA content and electrolyte leakage in wheat roots and leaves, which was consistent with the levels of O2˙ˉ and H2O2. Similarly, the high levels of MDA and electrolyte leakage in the roots might be due to the fact that excessive ROS accumulation in the roots enhanced lipid peroxidation, and in turn affected normal cellular functioning. Therefore, these results indicated that high concentration of nTiO2 resulted in the severe oxidative damage to wheat plants, especially for the roots.
Fig. 2. In vivo imaging of O2˙ˉ and H2O2 in the roots and leaves of CN19 under nTiO2 exposure for 14 days. For visualization of O2˙ˉ (A) and H2O2 (B), wheat roots and leaves were stained with the fluorescent probe dihydroethidium (DHE) and 2,7-dichlorofluorescin diacetate (DCFH-DA), respectively. Bars = 100 μm.
3.3. Cell death under nTiO2 exposure
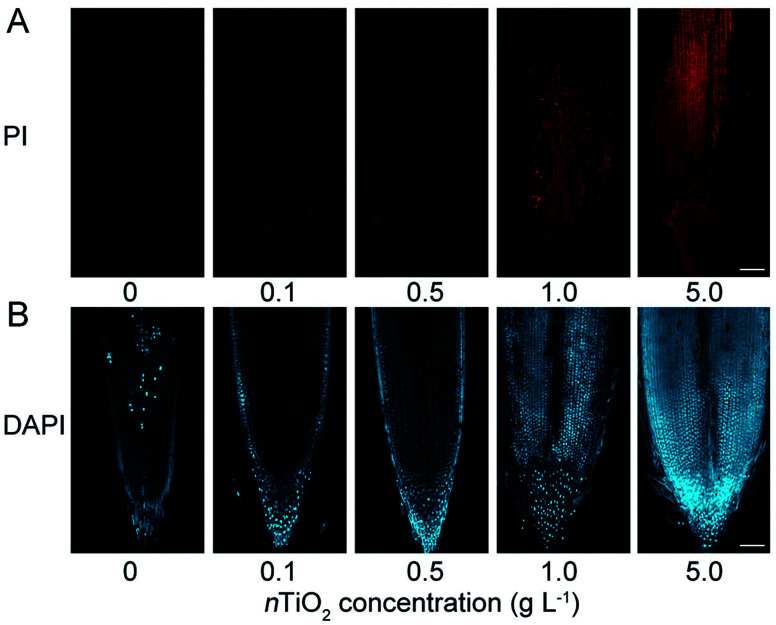
The above results demonstrated that nTiO2 exposure could induce excessive ROS accumulation and subsequently severe oxidative damage in wheat roots. To test whether the ROS accumulation leads to cell death in the roots, the plasma membrane (PM) integrity in root tips was examined by propidium iodide (PI) staining. PI is a membrane-impermeable dye that binds to nucleotides and its positive nucleus is a strong indicator of the loss of membrane integrity.51 Consistent with the phenomenon of ROS accumulation in wheat roots, the results obtained from PI staining showed that obvious cell death was observed in the primary root tips under nTiO2 exposure compared with the control (Fig. 3A and S2C†), especially for high concentrations of nTiO2. In addition, trypan-blue staining showed that 5.0 g nTiO2 L−1 also resulted in the obvious cell death in the leaves (Fig. S2C†). The more severe cell death in the roots further demonstrated that high concentrations of nTiO2 induced severe oxidative damage to wheat roots relative to the leaves.
Fig. 3. Characterization of cell death in primary roots of CN19 under nTiO2 exposure for 14 days. The root tips were stained with propidium iodide (PI) (A) and 4,6-diamidino-2-phenylindole (DAPI) (B), respectively. Bars = 100 μm.
Previous study indicated that heavy metal-induced cell death in the roots can happen through either programmed cell death (PCD) or necrosis.52 To test whether PCD is involved in the cell death in the roots, we studied the chromatin condensation by 4,6-diamidino-2-phenylin-dole (DAPI) staining. As shown in Fig. 3B, a marked increase of DAPI fluorescence was detected in the roots under nTiO2 exposure compared with the control, indicated that nTiO2 treatment induced severe cell death and suppresses chromatin condensation in wheat roots. Therefore, these findings suggest that plant usually can alleviate the toxicity to cells through PCD under nTiO2 exposure.
3.4. nTiO2 affects antioxidant defense system
The effects of NPs toxicity on the antioxidant activity of some key enzymes and antioxidants have been broadly reported. Several reports have showed the impacts of nTiO2 on the activities of antioxidant enzymes (CAT, SOD, and POD) in many plants.20,21,53 To test the differences in antioxidant system between the roots and leaves under nTiO2 exposure based on the different oxidative damage, we measured the activity of six antioxidant enzymes in the roots and leaves. As shown in Fig. S4,† the activity of GPX, CAT, APX, POD, and SOD significantly increased at different concentration of nTiO2 (0.5, 1.0 and 5.0 g nTiO2 L−1), while total GR activity significantly decreased after nTiO2 exposure compared with the control in the roots (Fig. S4E†). Relative to the control, the activity of GPX, CAT, POD, and SOD significantly increased at 1.0 and 5.0 g nTiO2 L−1 concentration, whereas the activity of APX and GR markedly reduced under nTiO2 exposure in the leaves (Fig. S4I and K†). In the roots and leaves, the reduction in GR activity corresponded with the high ROS accumulation, suggesting that the high concentration of nTiO2 improve the oxidative stress in wheat plants. Under nTiO2 treatment, the increase in the activities of several antioxidant enzymes may be due to the antioxidant system of nTiO2 acting as a scavenger of ROS.17 However, compared with the leaves, the roots showed the more significant decrease or increase in the activity of antioxidant enzymes under nTiO2 exposure. The reason is probably due to the fact that the roots touched directly with nTiO2, which could cause excessive generation and accumulation of ROS, and thereby resulted in the severe oxidative stress. To alleviate the oxidative damage to wheat roots, the activities of several antioxidant enzymes were significantly increased and subsequently the antioxidant system was acted for scavenging excessive ROS.
It is well known that ascorbate–glutathione cycle plays an important role in scavenging the toxic ROS with antioxidant enzymes together.54 The differences observed between the roots and leaves regarding ROS accumulation and cell death led us to further investigate the amounts of antioxidants. Compared with the control, although there was no significant changes in the concentrations of GSSG and DHA under nTiO2 exposure, treatment with nTiO2 resulted in the significant decline in the content of GSH and the marked enhancement in the AsA concentration in the roots and leaves (Fig. S5A and B†), especially at 1.0 and 5.0 g nTiO2 L−1. GR catalyzes the generation of reduced glutathione that is needed to regenerate ascorbated. In the present study, the low increase in contents of AsA was probably due to the significant decline in GR activity, which is consistent with the low concentration of free thiols that could low the production of ascorbate, and then lead to higher oxidative stress in the roots.17 All these results indicated that high concentration of nTiO2 caused the severe damage to the antioxidant defense system, and a high oxidative stress was occurred in wheat roots under nTiO2 exposure.
3.5. nTiO2 exposure reduced photosynthetic capacity
The oxidative damage occurred under stressful conditions usually was accompanied with the decline in photosynthetic efficiency.24 To investigate the effects of nTiO2 on photosynthesis of wheat, PSI and PSII photochemistry was analyzed in wheat leaves. PSI is not so invulnerable to environmental stresses like PSII.55 As shown in Fig. S6,† nTiO2 treatment did not leas to the significant decrease in PSI photochemical efficiency compared with the control under different light intensity except the maximal P700 signal (Pm) displayed a significant decline at 5 g nTiO2 L−1 concentration. This is probably due to a result from a permanently reduction of PSI donator side to protect PSI against the oxidative damage through excess radiation.31
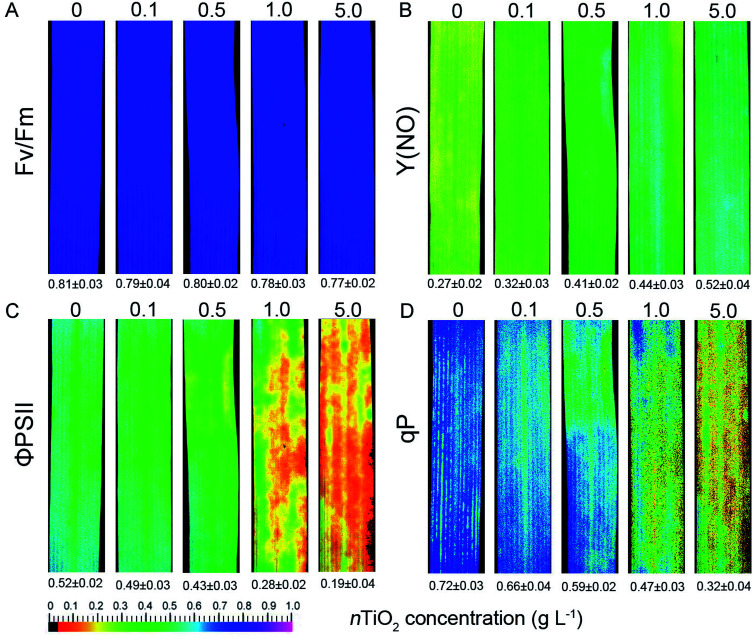
Chlorophyll fluorescence are usually considered as a non-invasive probe in investing photosynthetic capacity under environmental stresses in plants.23,24 Next, PSII photochemistry was studied in wheat seedlings exposed to different concentrations of nTiO2. When compared with control plants, nTiO2 exposure did not reduce the value of Fv/Fm (Fig. 4A). However, a significant increase in Y(NO) was observed at 0.5, 1.0, and 5.0 g nTiO2 L−1 concentration (Fig. 4B). The high level of Y(NO) indicated that photochemical energy conversion was insufficient at high nTiO2 concentrations in wheat.56,57 In contrast, the value and color of ΦPSII and qP displayed obvious decline at 0.5, 1.0, and 5.0 g nTiO2 L−1 concentration relative to the control (Fig. 4C and D). The reason was due to a reduction in the photochemical efficiency of the PSII complex under nTiO2 exposure.
Fig. 4. Chlorophyll fluorescence parameters of CN19 under nTiO2 exposure for 14 days. Fv/Fm (A), the maximum efficiency of PSII photochemistry; Y(NO) (B), quantum yield of non-regulated energy dissipation in PSII; ΦPSII (C), the quantum yield of PSII electron transport; qP (D), photochemical quenching. The values (mean ± SD) are presented below the individual fluorescence images.
It has been well known that excess light energy is harmlessly dissipated as heat by non-photochemical quenching (NPQ), which is the very important photoprotection process in PSII.31 In the present study, NPQ kinetics of wheat seedlings was investigated after nTiO2 exposure (Fig. S7†). Compared with the control, the induction of NPQ was slower and arrived at a lower amplitude at 0.5, 1.0 and 5.0 g nTiO2 L−1 concentration. During the dark recovery, the NPQ kinetics of 0.1, 0.5, and 1.0 g nTiO2 L−1 was similar with that of the control, while 5.0 g nTiO2 L−1 treatment resulted in a delayed recovery. The low value of NPQ under nTiO2 exposure suggested wheat plants did not dissipate effectively excess light energy by heat and thereby decrease the efficiency of photochemical reactions of photosynthesis.58,59 Furthermore, we also determined the capacity of state I to state II transition. State transitions is another important photoprotective mechanism and play a key regulatory role in the process of energy dissipation by binding LHCII with PSI or PSII.60 As shown in Fig. S8,† there was no obvious difference in state transition under nTiO2 exposure compared with the control. Only a transitory decrease of fluorescence occurred at 5.0 g nTiO2 L−1 when the first far-red light turned on (Fig. S8†).
Gas exchange parameters are good photosynthetic indicators for stressful tolerance in plants.24,61 To further investigate the toxic effects of nTiO2 on the photosynthetic apparatus, four gas exchange parameters (Pn, Tr, Ci, and Gs) were assayed. As shown in Fig. S9,† 0.1 and 0.5 g nTiO2 L−1 did not resulted in the obvious changes in gas exchange parameters. However, a significant decrease in three gas exchange parameters (Pn, Tr, and Gs) and increase in Ci were observed at high concentration of nTiO2, especially for 5.0 g nTiO2 L−1. Therefore, these results demonstrated that high concentration of nTiO2 resulted in the severe damage to photosynthetic apparatus, especially for PSII.
3.6. Changes in thylakoid membrane proteins and phosphorylation
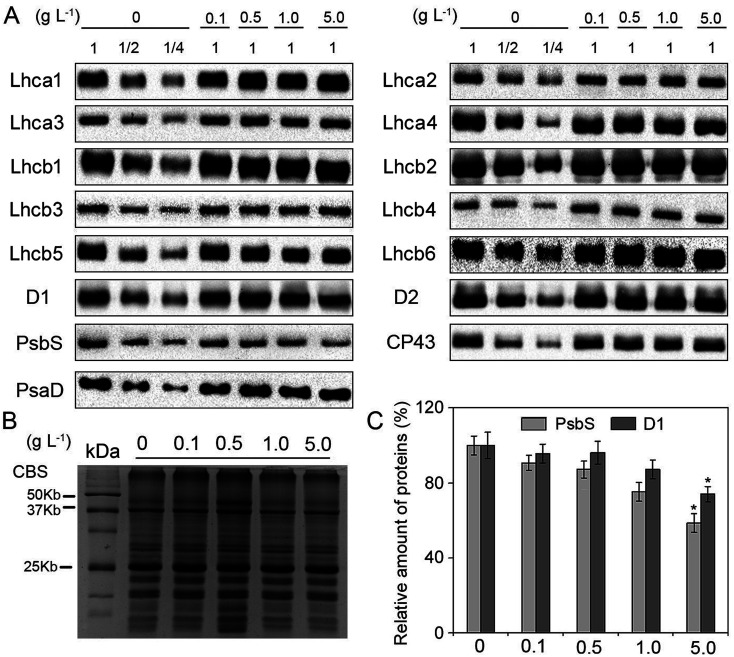
The composition of pigment-binding proteins could provide valuable information for further exploring the damage to PSII under nTiO2 exposure. Immunoblot analysis of PSI and PSII proteins showed that there were no detectable changes in the levels of all the analyzed thylakoid proteins except for D1 and PsbS at different concentrations of nTiO2 compared with the control (Fig. 5A and C). Relative to the control, 5 g nTiO2 L−1 led to a significant decrease (roughly 20% and 50%, respectively) in the amount of D1 and PsbS (Fig. 5C). Under environmental stresses, the D1 protein is the target site hampered.62–64 In general, the degradation of D1 protein is beneficial for PSII to avoid further oxidant damage and the PSII repair cycle.65 PsbS protein is the key regulator of the energy dissipation process.66 Therefore, the decrease in PsbS is probably necessary for the regulation of non-photochemical quenching under nTiO2 exposure.
Fig. 5. Accumulation of thylakoid proteins in CN19 under nTiO2 exposure for 14 days. (A) Specific antibodies including photosystem I (PSI) (Lhca1, Lhca2, Lhca3, Lhca4, PsaD) and photosystem II (PSII) proteins (D1, D2, CP43, Lhcb1, Lhcb2, Lhcb3, Lhcb4, Lhcb5, Lhcb6, PsbS) were used for immunoblotting analysis. Total chlorophyll (1 μg Chl) was loaded into each lane. (B) Coomassie blue staining (CBS) of SDS-PAGE were showed. Loading was done based on equal amount of total Chl (1 μg). (C) Quantitative analysis of D1 and PsbS proteins. The results are given relative to the content of control (100%). The significant differences were marked with * when P < 0.05 (n = 4).
It has been known that reversible phosphorylation of PSII core proteins and LHCII play an important role in the PSII repair cycle and the energy balance between PSI and PSII under stressful conditions,67,68 respectively. To study the effects of nTiO2 on the phosphorylation pattern of thylakoid membrane proteins, the phosphorylation of PSII core proteins (D1, D2, and CP43) and LHCII was detected using an anti-phosphothreonine antibody. Compared with the control, nTiO2 treatments did not induce higher levels of phosphorylation of CP43 and LHCII proteins (Fig. S10A and C†). However, the strong phosphorylated levels of D1 and D2 were found under 5.0 g nTiO2 L−1 exposure relative to the control. These results indicated that high concentration of nTiO2 could cause the strong phosphorylation of PSII reaction center proteins and subsequently alleviated the oxidative damage to PSII by accelerating the PSII repair cycle.
3.7. Ti accumulation
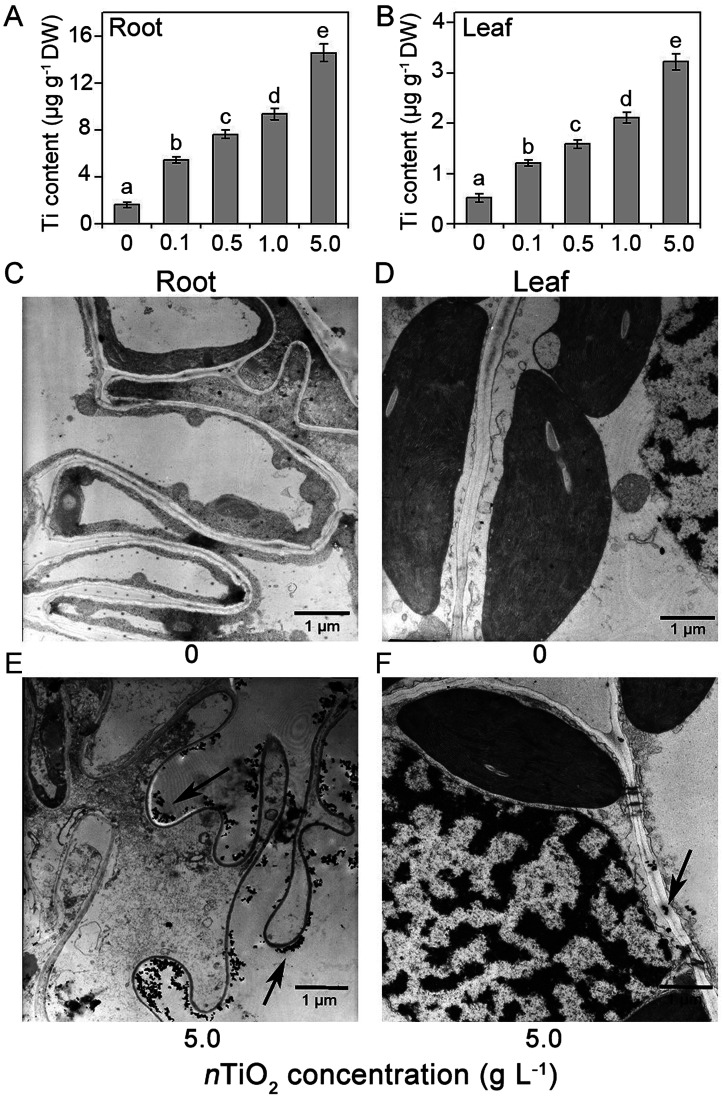
To explore the toxic reasons of high nTiO2 concentration in the roots and leaves, the concentrations and distribution of Ti were measured after 5 g nTiO2 L−1 treatment for 14 days. Compared with the control, Ti contents were significantly increased in the roots and leaves under nTiO2 exposure (Fig. 6A and B). However, the roots accumulated more higher concentrations of Ti relative to the leaves, suggesting that nTiO2 could be taken up efficiently by the roots and can not be transferred efficiently to the leaves, so that the roots were subject to more severe damage. To verify these findings, we investigated the ultrastructure of the roots and leaves with a transmission electron microscopy (Fig. 6C–F). Previous studies obtained form wheat and cucumber indicated that TiO2 NPs could penetrate the roots and enter into root cells.14,69 In agreement with these findings, we found that a large number of black grains were detected intercellular spaces of cortical tissues under 5 g nTiO2 L−1 treatment in the roots (Fig. 6C and E). However, we found that few black grains were accumulated in the chloroplast at 5 g nTiO2 L−1 concentration (Fig. 6D and F). Our results were consistent with the previous studies, in which no obvious accumulation of TiO2 was found in the leaf tissues in rice under TiO2 NPs exposure.14 In addition, relative to the control plants, the stacking of the grana was obvious reduced under 5 g nTiO2 L−1 exposure.
Fig. 6. Ti content (A and B) and TEM observation (C–F) of the roots and leaves in CN19 under nTiO2 exposure for 14 days. Data are represented as mean ± SD from four independent repetitions (n = 4). The Duncan's multiple range test showed that the values corresponding to the different letters were significantly different at P < 0.05. Condensed dark spots, shown with red arrow, indicated nTiO2.
4. Conclusions
Overall, the present study indicates that TiO2 NPs exposure could cause the severe oxidative damage to wheat roots and leaves and the subsequent decline in photosynthetic efficiency in wheat. This study also suggests that there were different antioxidant defense system and uptaking of Ti in response to TiO2 NPs treatment in wheat roots and leaves. In addition, the levels of some PSII proteins and protein phosphorylation were changed in wheat seedlings under TiO2 NPs exposure. Therefore, we propose that antioxidant system and PSII protein phosphorylation may play an important regulatory role in alleviating TiO2 NPs toxicity to the roots and leaves in wheat plants.
Conflicts of interest
There are no conflicts to declare.
Supplementary Material
Acknowledgments
This research was financially supported by Xichang Municipal Science and Technology Program (18JSYJ09), and Sichuan Science and Technology Program (2018HH0129). We thank Houguo Liang (Sichuan University) for assistance with transmission electron microscopy. We are especially grateful to Jian Li (Ohio University) for the language editing of the manuscript.
Electronic supplementary information (ESI) available. See DOI: 10.1039/c9ra02984b
Notes and references
- Forster S. P. Olveira S. Seeger S. Int. J. Nanotechnol. 2011;8:592–613. doi: 10.1504/IJNT.2011.040193. [DOI] [Google Scholar]
- Seeman N. C. Sleiman H. F. Nat. Rev. Mater. 2018;3:17068. doi: 10.1038/natrevmats.2017.68. [DOI] [Google Scholar]
- Komiyama M. Yoshimoto K. Sisido M. Ariga K. Bull. Chem. Soc. Jpn. 2017;90:967–1004. doi: 10.1246/bcsj.20170156. [DOI] [Google Scholar]
- Zhong S. Xu Q. Bull. Chem. Soc. Jpn. 2018;91:1606–1617. doi: 10.1246/bcsj.20180227. [DOI] [Google Scholar]
- Liu L. Corma A. Chem. Rev. 2018;118:4981–5079. doi: 10.1021/acs.chemrev.7b00776. [DOI] [PMC free article] [PubMed] [Google Scholar]
- Peralta-Videa J. R. Zhao L. Lopez-Moreno M. L. de la Rosa G. Hong J. Gardea-Torresdey J. L. J. Hazard. Mater. 2011;186:1–15. doi: 10.1016/j.jhazmat.2010.11.020. [DOI] [PubMed] [Google Scholar]
- Piccinno F. Gottschalk F. Seeger S. Nowack B. J. Nanopart. Res. 2012;14:1109. doi: 10.1007/s11051-012-1109-9. [DOI] [Google Scholar]
- Popov A. P. Priezzhev A. V. Lademann J. Myllylä R. J. Phys. D: Appl. Phys. 2005;38:2564–2570. doi: 10.1088/0022-3727/38/15/006. [DOI] [Google Scholar]
- Li L. D. Yan J. Q. Wang T. Zhao Z. J. Zhang J. Gong J. Guan N. Nat. Commun. 2015;6:5881. doi: 10.1038/ncomms6881. [DOI] [PubMed] [Google Scholar]
- Wiesner M. R. Lowry G. V. Alvarez P. Dionysiou D. Biswas P. Environ. Sci. Technol. 2006;40:4336–4345. doi: 10.1021/es062726m. [DOI] [PubMed] [Google Scholar]
- Gondikas A. P. Von der Kammer F. Reed R. B. Wagenr S. Ranville J. F. Hofmann T. Environ. Sci. Technol. 2014;48:5415–5422. doi: 10.1021/es405596y. [DOI] [PubMed] [Google Scholar]
- Miller R. J. Bennett S. Keller A. A. Pease S. Lenihan H. S. PLoS One. 2012;7:e30321. doi: 10.1371/journal.pone.0030321. [DOI] [PMC free article] [PubMed] [Google Scholar]
- Larue C. Laurette J. Herlin-Boime N. Khodja H. Fayard B. Flank A. M. Brisset F. Carriere M. Sci. Total Environ. 2012;431:197–208. doi: 10.1016/j.scitotenv.2012.04.073. [DOI] [PubMed] [Google Scholar]
- Servin A. Morales M. I. Castillo-Michel H. Hernandez-Viezcas J. Munoz B. Zhao L. Nunez J. E. Peralta-Videa J. R. Gardea-Torresdey J. L. Environ. Sci. Technol. 2013;47:11592–11598. doi: 10.1021/es403368j. [DOI] [PubMed] [Google Scholar]
- Wang Z. Y. Yu X. L. Gao D. M. Feng W. Q. Xing B. S. Li F. M. Huanjing Kexue. 2010;31:480–487. [PubMed] [Google Scholar]
- Gao J. G. Xu G. D. Qian H. H. Liu P. Zhao P. Hu Y. Environ. Pollut. 2013;176:63–70. doi: 10.1016/j.envpol.2013.01.027. [DOI] [PubMed] [Google Scholar]
- Rico C. M. Hong J. Morales M. I. Zhao L. Barrios A. C. Zhang J. Y. Peralta-Videa J. R. Gardea-Torresdey J. L. Environ. Sci. Technol. 2013;47:5635–5642. doi: 10.1021/es401032m. [DOI] [PubMed] [Google Scholar]
- Ma X. Wang Q. Rossi L. Zhang W. Environ. Sci. Technol. 2016;50:6793–6802. doi: 10.1021/acs.est.5b04111. [DOI] [PubMed] [Google Scholar]
- Spengler A. Wanninger L. Pflugmacher S. Aquat. Toxicol. 2017;190:32–39. doi: 10.1016/j.aquatox.2017.06.006. [DOI] [PubMed] [Google Scholar]
- Hong F. Yang F. Liu C. Gao Q. Wan Z. Gu F. Wu C. Ma Z. Zhou J. Yang P. Biol. Trace Elem. Res. 2005;104:249–260. doi: 10.1385/BTER:104:3:249. [DOI] [PubMed] [Google Scholar]
- Li F. Zhao W. Li Y. Y. Tian Z. J. Wang Z. Y. Huanjing Kexue. 2012;33:233–238. [PubMed] [Google Scholar]
- Pagliano C. Saracco G. Barber J. Photosynth. Res. 2013;116:167–188. doi: 10.1007/s11120-013-9803-8. [DOI] [PubMed] [Google Scholar]
- Murata N. Takahashi S. Nishiyama Y. Allakhverdiev S. I. Biochim. Biophys. Acta. 2007;1767:414–421. doi: 10.1016/j.bbabio.2006.11.019. [DOI] [PubMed] [Google Scholar]
- Chen Y. E. Zhang C. M. Su Y. Q. Ma J. Zhang Z. W. Yuan M. Zhang H. Y. Yuan S. Environ. Exp. Bot. 2017;135:45–55. doi: 10.1016/j.envexpbot.2016.12.001. [DOI] [Google Scholar]
- Iswarya V. Bhuvaneshwari M. Alex S. A. Iyer S. Chaudhuri G. Chandrasekaran P. T. Bhalerao G. M. Chakravarty S. Raichur A. M. Chandrasekaran N. Mukherjee A. Aquat. Toxicol. 2015;161:154–169. doi: 10.1016/j.aquatox.2015.02.006. [DOI] [PubMed] [Google Scholar]
- Su M. Wu X. Liu C. Qu C. Liu X. Chen L. Huang H. Hong F. Biol. Trace Elem. Res. 2007;119:183–192. doi: 10.1007/s12011-007-0065-1. [DOI] [PubMed] [Google Scholar]
- Zheng L. Hong F. Lu S. Liu C. Biol. Trace Elem. Res. 2005;104:83–91. doi: 10.1385/BTER:104:1:083. [DOI] [PubMed] [Google Scholar]
- Yang F. Liu C. Gao F. Su M. Wu X. Zheng L. Hong F. Yang P. Biol. Trace Elem. Res. 2007;119:77–88. doi: 10.1007/s12011-007-0046-4. [DOI] [PubMed] [Google Scholar]
- Li J. Naeem M. S. Wang X. P. Liu L. X. Chen C. Ma N. Zhang C. L. PLoS One. 2015;10:e0143885. doi: 10.1371/journal.pone.0143885. [DOI] [PMC free article] [PubMed] [Google Scholar]
- Song U. Jun H. Waldman B. Roh J. Kim Y. Yi J. Lee E. J. Ecotoxicol. Environ. Saf. 2013;93:60–67. doi: 10.1016/j.ecoenv.2013.03.033. [DOI] [PubMed] [Google Scholar]
- Mao H. T. Chen M. Y. Su Y. Q. Wu N. Yuan M. Yuan S. Brestic M. Zivcak M. Zhang H. Y. Chen Y. E. Int. J. Mol. Sci. 2018;19:3006. doi: 10.3390/ijms19103006. [DOI] [PMC free article] [PubMed] [Google Scholar]
- Sandalio L. M. Rodríguez-Serrano M. Romero-Puertas M. C. Del Río L. A. Methods Enzymol. 2008;440:397–409. doi: 10.1016/S0076-6879(07)00825-7. [DOI] [PubMed] [Google Scholar]
- Xu J. Zhu Y. Y. Ge Q. Li Y. L. Sun J. H. Zhang Y. Liu X. J. New Phytol. 2012;196:125–138. doi: 10.1111/j.1469-8137.2012.04236.x. [DOI] [PubMed] [Google Scholar]
- Maxwell K. Johnson G. N. J. Exp. Bot. 2000;51:659–668. doi: 10.1093/jexbot/51.345.659. [DOI] [PubMed] [Google Scholar]
- Pietrzykowska M. Suorsa M. Semchonok D. A. Tikkanen M. Boekema E. J. Aro E. M. Jansson S. Plant Cell. 2014;26:3646–3660. doi: 10.1105/tpc.114.127373. [DOI] [PMC free article] [PubMed] [Google Scholar]
- Leoni C. Pietrzykowska M. Kiss A. Z. Suorsa M. Ceci L. R. Aro E. M. Jansson S. Plant J. 2013;76:236–246. doi: 10.1111/tpj.12297. [DOI] [PMC free article] [PubMed] [Google Scholar]
- Klughammer C. Schreiber U. Planta. 1994;192:261–268. doi: 10.1007/BF01089043. [DOI] [Google Scholar]
- Chen Y. E. Yuan S. Schröder W. P. Physiol. Plant. 2016;156:3–12. doi: 10.1111/ppl.12384. [DOI] [PubMed] [Google Scholar]
- Porra R. J. Thompson W. A. Kriedemann P. E. Biochim. Biophys. Acta. 1989;975:384–394. doi: 10.1016/S0005-2728(89)80347-0. [DOI] [Google Scholar]
- Laemmli U. K. Nature. 1970;227:680–685. doi: 10.1038/227680a0. [DOI] [PubMed] [Google Scholar]
- Foltête A. S. Masfaraud J. F. Bigorgne E. Nahmani J. Chaurand P. Botta C. Labille J. Rose J. Férard J. F. Cotelle S. Environ. Pollut. 2011;159:2515–2522. doi: 10.1016/j.envpol.2011.06.020. [DOI] [PubMed] [Google Scholar]
- Silva S. Craveiro S. C. Oliveira H. Calado A. J. Pinto R. J. B. Silva A. M. S. Santos C. Plant Physiol. Biochem. 2017;121:89–98. doi: 10.1016/j.plaphy.2017.10.013. [DOI] [PubMed] [Google Scholar]
- Frazier T. P. Burklew C. E. Zhang B. Funct. Integr. Genomics. 2014;14:75–83. doi: 10.1007/s10142-013-0341-4. [DOI] [PubMed] [Google Scholar]
- Pérez-Alfocea F. Larher F. Plant Sci. 1995;107:9–15. doi: 10.1016/0168-9452(95)04087-B. [DOI] [Google Scholar]
- Foyer C. H. Shigeoka S. Plant Physiol. 2011;155:93–100. doi: 10.1104/pp.110.166181. [DOI] [PMC free article] [PubMed] [Google Scholar]
- Xia T. Kovochich M. Liong M. Madler L. Gilbert B. Shi H. Yeh J. I. Zink J. I. Nel A. E. ACS Nano. 2008;2:2121–2134. doi: 10.1021/nn800511k. [DOI] [PMC free article] [PubMed] [Google Scholar]
- Wang H. Kou X. Pei Z. Xiao J. Q. Shan X. Xing B. Nanotoxicology. 2011;5:30–42. doi: 10.3109/17435390.2010.489206. [DOI] [PubMed] [Google Scholar]
- Kumari M. Sudheer Khan S. Pakrashi S. Mukherjee A. Chandrasekaran N. J. Hazard. Mater. 2011;190:613–621. doi: 10.1016/j.jhazmat.2011.03.095. [DOI] [PubMed] [Google Scholar]
- Begum P. Ikhtiari R. Fugetsu B. Carbon. 2011;49:3907–3919. doi: 10.1016/j.carbon.2011.05.029. [DOI] [Google Scholar]
- Sharma P. Jha A. B. Dubey R. S. Pessarakli M. J. Bot. 2012;2012:217037. [Google Scholar]
- De Cnodder T. Vissenberg K. Van der Straeten D. Verbelen J. P. New Phytol. 2005;168:541–550. doi: 10.1111/j.1469-8137.2005.01540.x. [DOI] [PubMed] [Google Scholar]
- Xu J. Yin H. X. Li Y. L. Liu X. J. Plant Physiol. 2010;154:1319–1334. doi: 10.1104/pp.110.162982. [DOI] [PMC free article] [PubMed] [Google Scholar]
- Tan W. J. Du W. C. Barriors A. C. Armendariz Jr R. Zuverza-Mena N. Ji Z. X. Chang C. H. Zink J. I. Hernandez-Viezcas J. A. Peralta-Videa J. R. Gardea-Torresdey J. L. Environ. Pollut. 2017;222:64–72. doi: 10.1016/j.envpol.2017.01.002. [DOI] [PubMed] [Google Scholar]
- Foyer C. H. Noctor G. Plant Physiol. 2011;155:2–18. doi: 10.1104/pp.110.167569. [DOI] [PMC free article] [PubMed] [Google Scholar]
- Sonoike K. Physiol. Plant. 2011;142:56–64. doi: 10.1111/j.1399-3054.2010.01437.x. [DOI] [PubMed] [Google Scholar]
- Kramer D. M. Johnson G. Kiirats O. Edwards G. E. Photosynth. Res. 2004;79:209–218. doi: 10.1023/B:PRES.0000015391.99477.0d. [DOI] [PubMed] [Google Scholar]
- Sperdouli I. Moustakas M. Plant Biol. 2012;14:118–128. doi: 10.1111/j.1438-8677.2011.00473.x. [DOI] [PubMed] [Google Scholar]
- Gilmore A. M. Physiol. Plant. 1997;99:197–209. doi: 10.1111/j.1399-3054.1997.tb03449.x. [DOI] [Google Scholar]
- De Bianchi S. Dall'Osto L. Tognon G. Morosinotto T. Bassi R. Plant Cell. 2008;20:1012–1028. doi: 10.1105/tpc.107.055749. [DOI] [PMC free article] [PubMed] [Google Scholar]
- Allen J. F. Biochim. Biophys. Acta. 1992;1098:275–335. doi: 10.1016/S0005-2728(09)91014-3. [DOI] [PubMed] [Google Scholar]
- Chen Y. E. Cui J. M. Su Y. Q. Zhang C. M. Ma J. Zhang Z. W. Yuan M. Liu W. J. Zhang H. Y. Yuan S. Sci. Rep. 2017;7:12718. doi: 10.1038/s41598-017-13145-1. [DOI] [PMC free article] [PubMed] [Google Scholar]
- Jansen M. A. K. Gaba V. Greenberg B. M. Mattoo A. K. Edelman M. Plant J. 1996;9:693–699. doi: 10.1046/j.1365-313X.1996.9050693.x. [DOI] [Google Scholar]
- Yamamoto Y. Front. Plant Sci. 2016;7:1136. doi: 10.3389/fpls.2016.01136. [DOI] [PMC free article] [PubMed] [Google Scholar]
- Su X. Wu S. Yang L. Xue R. Li H. Wang Y. Zhao H. Plant Growth Regul. 2014;74:311–318. doi: 10.1007/s10725-014-9920-1. [DOI] [Google Scholar]
- Aro E. M. Virgin I. Andersson B. Biochim. Biophys. Acta. 1993;1143:113–134. doi: 10.1016/0005-2728(93)90134-2. [DOI] [PubMed] [Google Scholar]
- Johnson M. P. Ruban A. V. Plant J. 2010;61:283–289. doi: 10.1111/j.1365-313X.2009.04051.x. [DOI] [PubMed] [Google Scholar]
- Samol I. Shapiguzov A. Ingelsson B. Fucile G. Crèvecoeur M. Vener A. V. Rochaix J. D. Goldschmidt-Clermont M. Plant Cell. 2012;24:2596–2609. doi: 10.1105/tpc.112.095703. [DOI] [PMC free article] [PubMed] [Google Scholar]
- Tikkanen M. Aro E. M. Biochim. Biophys. Acta. 2012;1817:232–238. doi: 10.1016/j.bbabio.2011.05.005. [DOI] [PubMed] [Google Scholar]
- Deng Y. Petersen E. J. Challis K. E. Rabb S. A. Holbrook R. D. Ranville J. F. Nelson B. C. Xing B. Environ. Sci. Technol. 2017;51:10615–10623. doi: 10.1021/acs.est.7b01364. [DOI] [PMC free article] [PubMed] [Google Scholar]
Associated Data
This section collects any data citations, data availability statements, or supplementary materials included in this article.


