Figure 3.
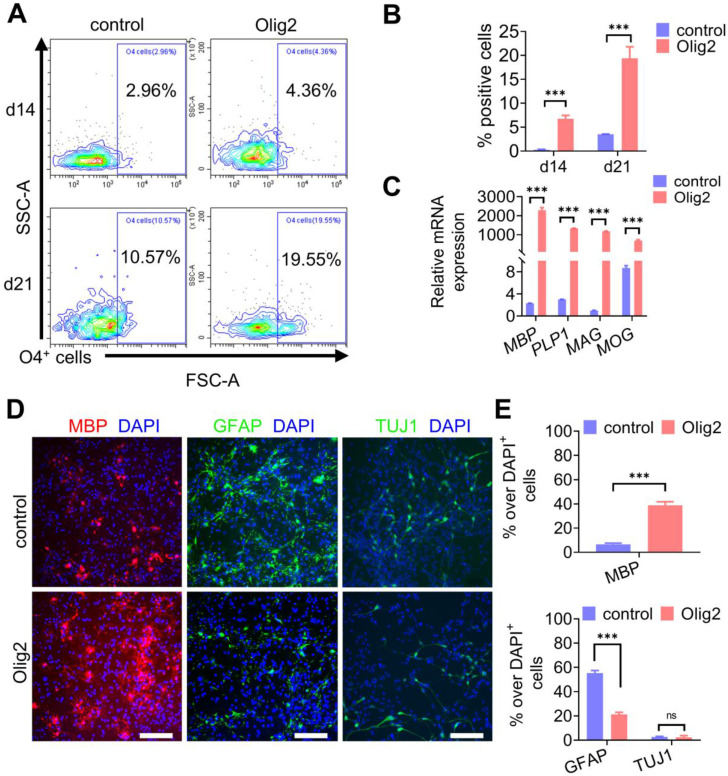
Maturation of Olig2-OPCs into OLs. A Representative flow cytometry analyses for the expression of O4+ cells at d7, d14 and d21 of differentiation. B Quantification of O4+ cells in control and Olig2 induction cultures at d7, d14 and d21 of differentiation (*** p < 0.001, by a two-tailed Student's t test). C The mRNA expression levels of MBP, PLP1, MAG, and MOG at d21 of OL differentiation (*** p < 0.001, by a two-tailed Student's t test). D Immunostaining of MBP, GFAP and TUJ1 at d21 of differentiation; scale bars, 100 μm. E Quantification of MBP+ OLs, GFAP+ astrocytes and TUJ1+ neurons in the control and Olig2 induction cultures at d21 of differentiation (ns p > 0.05, *** p < 0.001, by a two-tailed Student's t test). The graphs represent the individual data points and the mean ± SEM of three independent experiments. Immunofluorescence images are representative of n = 3 biological replicates.

