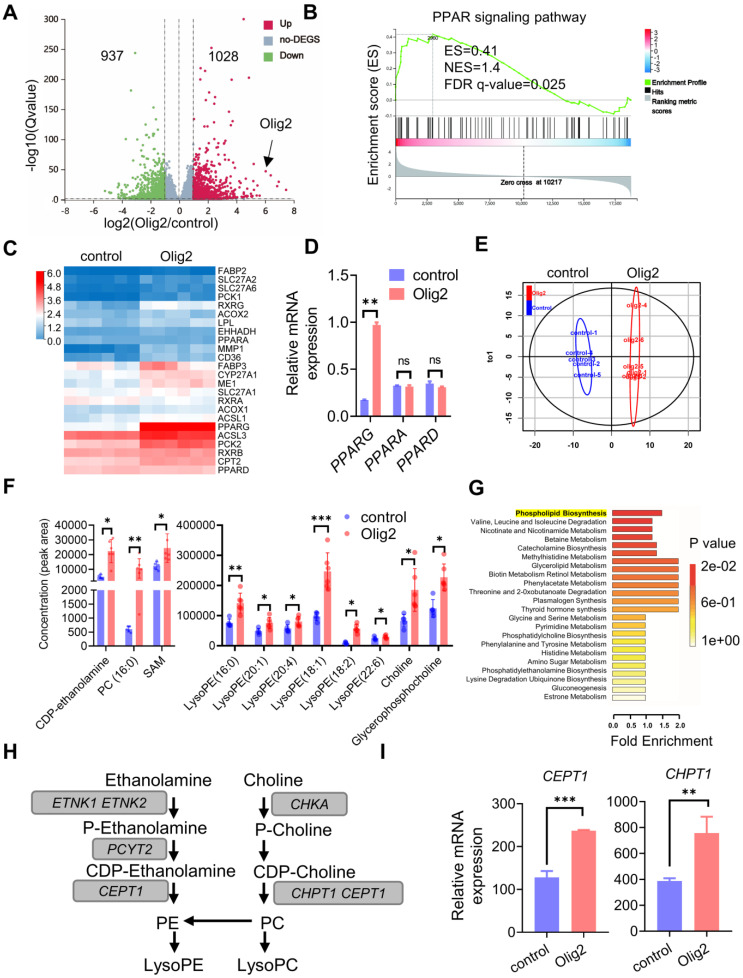
Figure 4.
Olig2 overexpression altered the expression of genes and metabolites involved in the PPARγ-mediated phospholipogenesis pathway. A Volcano plots of significantly differentially expressed genes (DEGs). Transcriptome analysis of Olig2-OPCs and control-OPCs (n = 6), red, upregulated; green, downregulated. B Gene set enrichment analysis (GSEA) indicated strong enrichment of the PPAR signaling pathway in Olig2-OPCs. C Heatmap evaluation of the expression of genes linked to lipid metabolism. D The mRNA expression levels of PPARG, PPARA, and PPARD in Olig2-OPCs and control-OPCs (ns p > 0.05, ** p < 0.01, by a two-tailed Student's t test). E PCA score plots of HILICESI+-MS metabolomics profiles obtained from HILIC-ESI+-MS, control-OPCs, n = 5; Olig2-OPCs, n = 6. F Metabonomic analysis showed that several species of intermediates and hydrolysates of phospholipid biosynthesis were increased in Olig2-OPCs (n = 5/6, * p < 0.05, ** p < 0.01, *** p < 0.001, by a two-tailed Student's t test). G Metabolite set enrichment analysis (MSEA) showed differential metabolites highly enriched in phospholipid biosynthesis in Olig2-OPCs. H The mRNA expression levels of CEPT1 and CHPT1 in Olig2-OPCs and control-OPCs (** p < 0.01, *** p < 0.001, by a two-tailed Student's t test). The graphs represent the individual data points and the mean ± SEM of three independent experiments.

