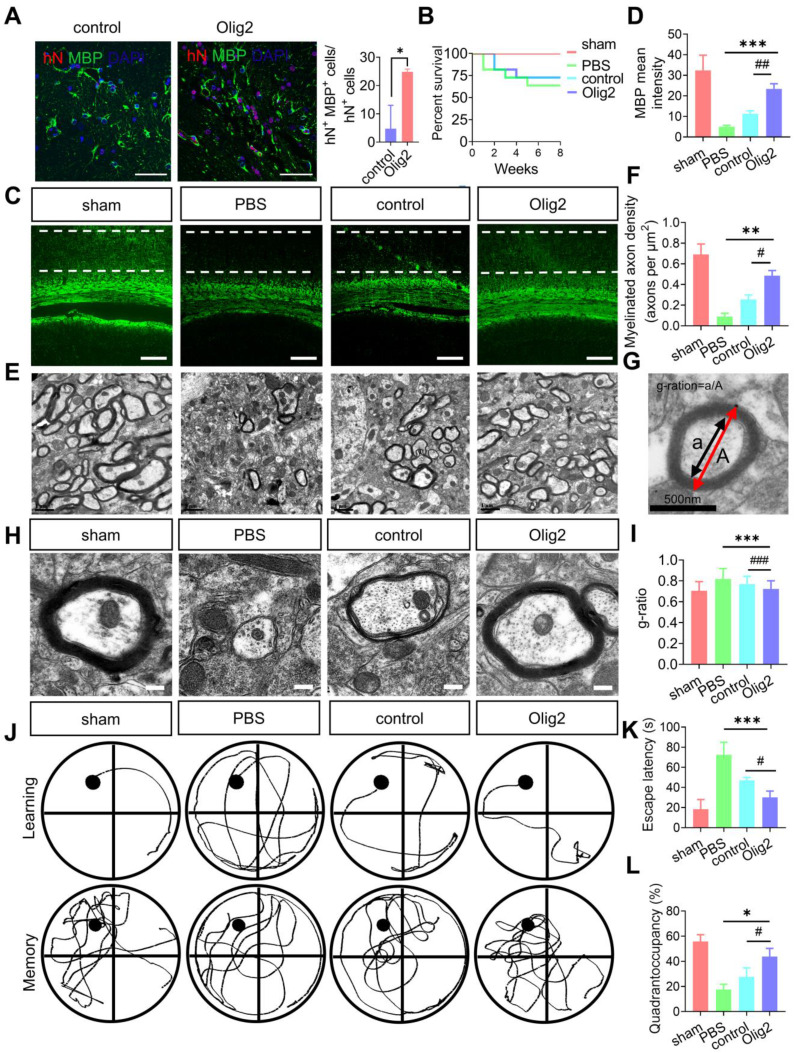
Figure 7.
Enhanced OL generation and remyelination by Olig2-OPC transplantation promoted the recovery of spatial learning and cognitive ability. A Representative immunofluorescent staining of hippocampal sections in the sham, PBS and groups that received cell transplantation (scale bar, 100 μm). Donor-derived myelination defined by MBP staining (green) was apparent throughout the hippocampus in rats receiving Olig2-OPCs at 8 weeks. In contrast, very few MBP+ cells expressed hN in animals receiving control-OPC transplantation (scale bar, 100 μm, * p < 0.05, by a two-tailed Student's t test). B Analysis of survival (percentage, Kaplan-Meier) from the sham and PBS groups and groups that received cell transplantation. C Representative immunofluorescent images of MBP in the sham, PBS and groups that received cell transplantation (scale bar, 100 μm). D Quantitative analysis of the fluorescence intensity of MBP staining in the CA1 region (*** p < 0.001, comparison between the sham group and the group that received cell transplantation; ## p < 0.01, by one-way ANOVA, comparison between the two groups that received cell transplants, by one-way ANOVA). E Representative electron micrographs of brain sections from the sham, PBS and groups that received cell transplantation (scale bar, 1 μm). F Quantitative analysis of the density of myelinated axons from sham, PBS and groups that received control-OPC and Olig2-OPC transplantation (** p < 0.01, comparison between the sham versus groups that received cell transplants; # p < 0.05, by one-way ANOVA, comparison between the two groups that received cell transplantation, by one-way ANOVA). G Diagram and analysis of the average g-ratios of myelinated axons. Line “A” indicates the diameter of a myelinated axon fiber, and line “a” indicates the diameter of the axonal caliber. Scale bar, 0.5 μm. H Representative electron micrographs at high magnification. Scale bars, 0.2 μm. I Mean g ratio of the four groups (n = 100, *** p < 0.001, comparison between the sham group and the group that received cell transplantation; ### p < 0.001, by one-way ANOVA, comparison between the two groups that received cell transplantation, by two-way ANOVA). J Representative sample paths from the maze trials (upper panel) and the search patterns on the probe trials (lower panel) after 8 weeks. K The Morris water maze test was performed to determine the spatial learning ability of the four groups, as shown by the time (escape latency) to find the submerged platform after 8 weeks (n = 6/7, *** p < 0.001, comparison between the sham group and the group that received cell transplantation; # p < 0.05, by two-way ANOVA, comparison between the two groups that received cell transplantation, by one-way ANOVA). L Probe trials were performed 4 h after the last maze trials and monitored by relative radial quadrant occupancy (time spent in the target quadrant, n = 6/7, * p < 0.05, comparison between the sham group versus the group that received cell transplantation; # p < 0.05, by one-way ANOVA, comparison between the two groups that received cell transplantation, by one-way ANOVA). The graphs represent the individual data points and the mean ± SEM of three independent experiments.

