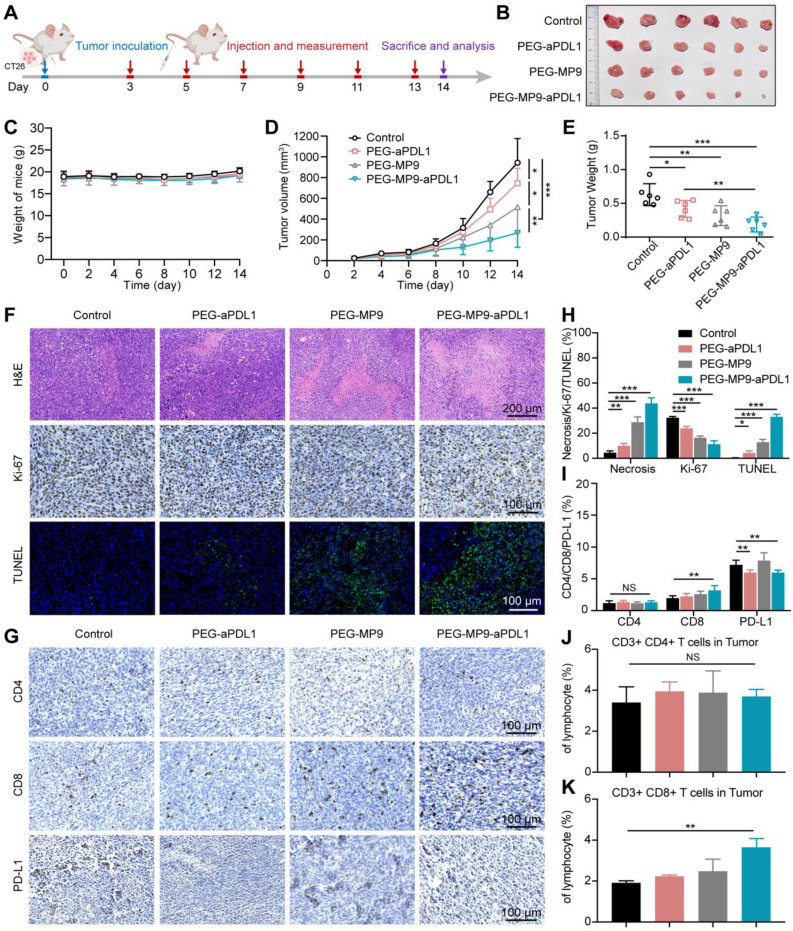
Figure 6.
In vivo antitumor efficacy and the evaluation of the immune response in CT26 tumor model. (A) Schematic illustration of the timeline for the in vivo study. (B) Images of excised CT26 tumors. (C) Body weight of mice bearing CT26 tumors throughout the study. (D) Tumor growth curves (n = 6). (E) Weight of CT26 tumors. Representative images of H&E, Ki-67, and TUNEL staining of tumor samples collected from different groups (F) and image-based quantitative results (H) (n = 6). Representative images of tumor samples following immunohistochemical staining for CD4+, CD8+, and PD-L1 (G) and quantified results of the images (I) (n = 6). Flow cytometry analysis of CD4+ (J), CD8+ T cells (K) isolated from CT26 tumors after PBS, PEG-aPDL1, PEG-MP9, and PEG-MP9-aPDL1 treatment (n = 3). Statistical significance: *p < 0.05, **p < 0.01, and ***p < 0.001.

