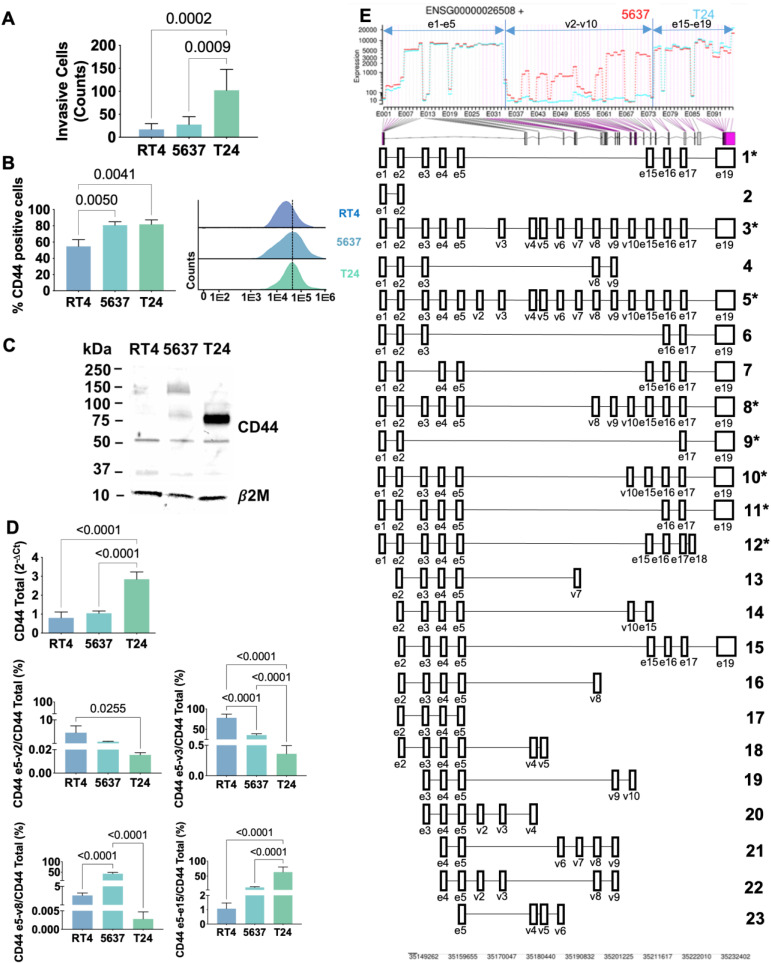
Figure 3.
Highly invasive T24 bladder cancer cells express high levels of CD44s. A) Capacity to invade Matrigel in vitro for RT4, 5637 and T24 cells. Grades I/II cell lines (RT4 and 5637) are significantly less capable of invading Matrigel in vitro. B) CD44 expression is higher for grade II (5637) and III (T24) cells. Flow cytometry analysis showed significantly higher CD44 levels in 5637 and T24 compared to RT4 cells. C) Western blots show different CD44 expression patterns according to cell grade, with T24 cells showing mostly shorter proteoforms. WB confirmed the overexpression of shorter CD44 proteoforms (at approximately 75 and 50 kDa) in T24 cells, and the presence of heavier proteoforms in the other cell lines (above 150 kDa). D) Characterization of CD44 isoforms by RT-PCR showing isoforms shortening with cell lines aggressiveness and the marked CD44shigh phenotype of T24 cells. CD44 gene expression was significantly higher in T24 in comparison to RT4 and 5637 cells, in agreement with protein analysis. RT-PCR also revealed increasing mRNA shortening with cells aggressiveness. Accordingly, RT4 showed higher e5-v2 and e5-v3 transcripts in comparison to the other cell lines, 5637 predominantly presented e5-v8, whereas T24 cells mainly expressed e5-e15 characteristic of CD44s/st. E) RNAseq confirmed the marked difference between T24 and 5637 cells, the first expressing shorter CD44 mRNAs in opposition to lengthier mRNAs in 5637 cells. The top image is a DESeq2's plot for visualization of alternative splicing events. The plot shows the coverage of constitutive and variable exons for 5637 (in red) and T24 (in blue) cells. The bottom part of the image shows the gene structure and depicts differentially expressed exons (purple lines linked to the x-axis of the coverage plot). The main differences are found in the variable region spanning v2-v10, which was mostly missing in T24 cells. Predicted transcripts are shown in the bottom. Asterisks highlight those showing transcripts higher probability of generating proteins and, therefore, used for glycoprotegenomics. Legend for panel E with Uniprot and Ensemble codes: 1- P16070-12 (CD44-201); 2- E9PKC6 (CD44-222); 3- P16070-4 (CD44-206); 4- CD44-227 (no Uniprot code); 5- P16070-1 (CD44-208); 6- H0YD13 (CD44-224); 7- Q86UZ1 (CD44-207); 8- P16070-10 (CD44-209); 9- P16070-19 (CD44-203); 10- P16070-11 (CD44-210); 11- P16070-18 (CD44-205); 12- H0Y5E4 (CD44-211); 13- H0YDW7 (CD44-221); 14- H0Y2P0 (CD44-204); 15- CD44-232 (no Uniprot code); 16- H0YD17 (CD44-228); 17-H0YD90 (CD44-234); 18- CD44-213 (no Uniprot code); 19- H0YEU1 (CD44-231); 20- H0YEV3 (CD44-219); 21- H0YES0 (CD44-212). The results for A-D correspond to the mean and standard deviation for three independent experiments. Triplicate measurements were conducted for each experiment. P values are presented for one-way ANOVA tests.

