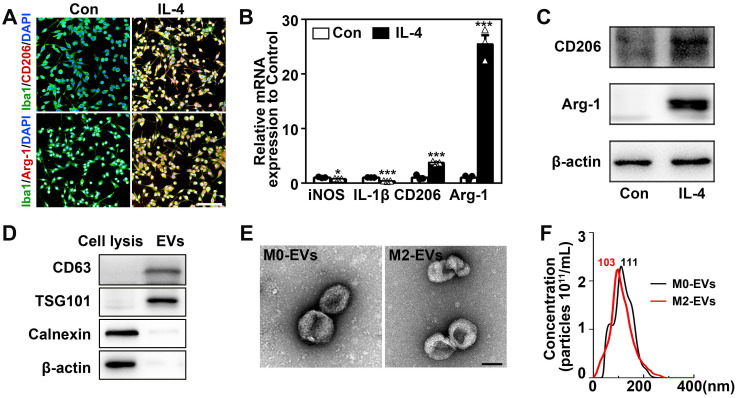
Figure 1.
Identification of M2 microglia and microglia-derived EVs. (A) Representative immunofluorescent images of IL-4 treated and the control microglia co-stained with Iba1 (green) and CD206/ Arg-1 (red). Scale bar = 200 µm. (B) RT-PCR analysis of iNOS, IL-1β, CD206 and Arg-1 expression in the IL-4 treated and the control microglia (n = 3). *, p < 0.05; ***, p < 0.005. (C) Western blots showing CD206 and Arg-1 expression in the IL-4 treated and the control microglia. (D) Western blot analysis of CD63, TSG101, Calnexin and β-actin in microglial cell lysis and microglia-derived EVs. (E) Representative TEM images of M0-EVs and M2-EVs. Scale bar = 100 nm. (F) Nanoparticle tracking analysis of M0-EVs and M2-EVs.

