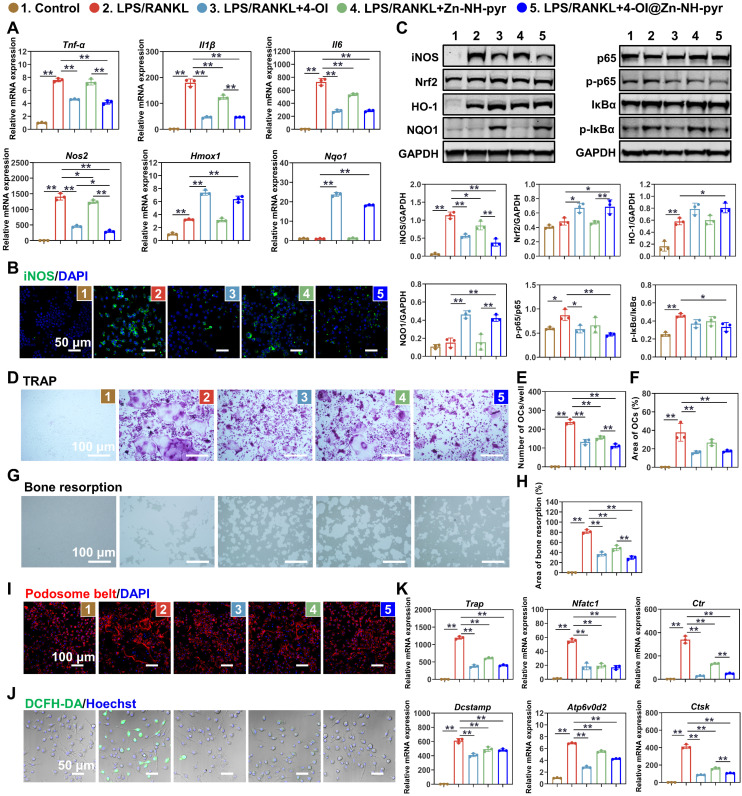
Figure 6.
Effect of 4-OI@Zn-NH on inflammatory macrophages and OCs. (A) Expression of pro-inflammatory genes evaluated by RT-qPCR in macrophages (mean ± SD, one-way ANOVA with Tukey's multiple comparison test, n = 3 independent samples). (B) Immunofluorescence of iNOS in LPS-activated macrophages with various treatment groups (n = 3 independent samples). (C) Western blotting showing the expression of Nrf2-related anti-inflammatory pathways and the activation of NF-κB pathways with various treatment groups (mean ± SD, one-way ANOVA with Tukey's multiple comparison test, n = 3 independent samples). (D) TRAP staining of BMMs stimulated by RANKL for 4 days with various treatment groups (n = 3 independent samples). (E) Number of TRAP-positive cells (mean ± SD, one-way ANOVA with Tukey's multiple comparison test, n = 3 independent samples). (F) Area of TRAP-positive cells (mean ± SD, one-way ANOVA with Tukey's multiple comparison test, n = 3 independent samples). (G) Osteo Assay plates showing the bone resorption of OCs with various treatment groups (n = 3 independent samples). (H) Area of bone resorption (mean ± SD, one-way ANOVA with Tukey's multiple comparison test, n = 3 independent samples). (I) Immunofluorescence of podosome belt in RANKL-stimulated BMMs with various treatment groups (n = 3 independent samples). (J) Confocal images of RANKL-stimulated BMMs with various treatment groups stained with DCFH-DA (n = 3 independent samples). (K) Expression of OCs related genes evaluated by RT-qPCR in BMMs stimulated by RANKL for 4 days with various treatment groups (mean ± SD, one-way ANOVA with Tukey's multiple comparison test, n = 3 independent samples). *P < 0.05; **P < 0.01.

