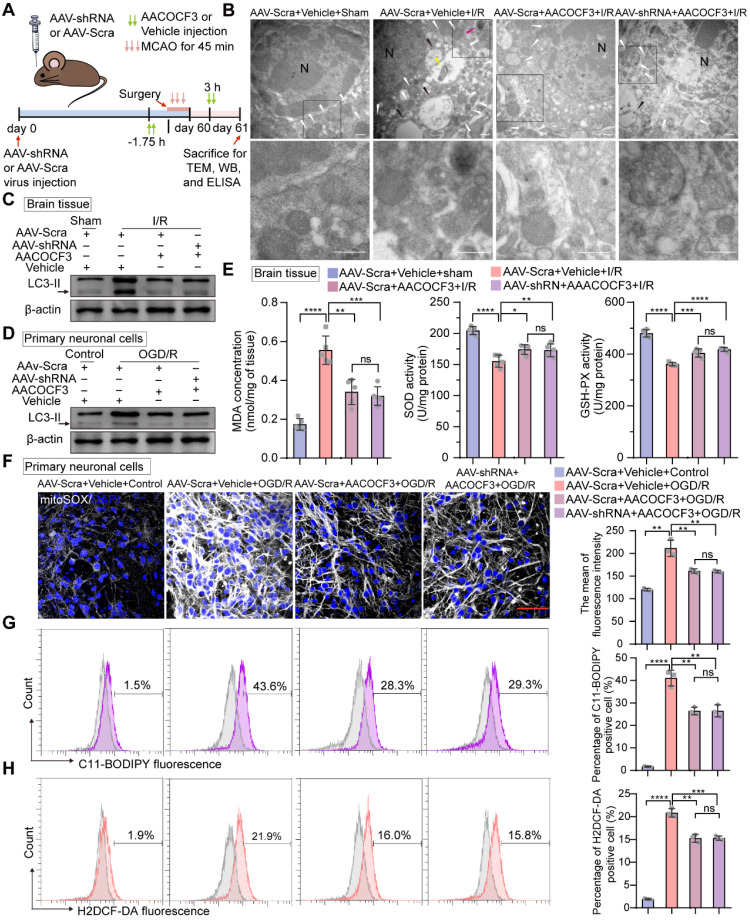
Figure 6.
Inhibition of neuronal PTRF renders cells blunt to autophagy and decreases lipid peroxidation and ferroptosis in neurons via PLA2G4A. (A) The experimental protocol used. (B) TEM of the ipsilateral penumbras from AAV-shRNA transfected mice co-treated with AACOCF3 (25 mg/kg body weight) after I/R injury. White arrowheads, mitochondria; red arrowheads, autophagy; yellow arrowheads, mitophagy; black arrowheads, swelling of cytoplasmic and organelle, as well as plasma membrane rupture. Scale bar = 500 nm. (C) Representative Western blot analyses of the LC3-II levels in the ipsilateral penumbras from AAV-shRNA transfected mice co-treated with AACOCF3 (25 mg/kg body weight) after I/R injury. (D) Representative Western blot analyses of the LC3-II levels in AAV-shRNA transfected primary neuronal cells co-treated with AACOCF3 (0.010 mM) under OGD/R. (E) MDA concentration, SOD, and GSH-Px activities were determined using corresponding kits in the ipsilateral penumbras from AAV-shRNA transfected mice co-treated with AACOCF3 (25 mg/kg body weight) after I/R injury (n = 5). (F) Representative images of mitoSOX in AAV-shRNA transfected primary neuronal cells co-treated with AACOCF3 under OGD/R. Neurons were counterstained with DAPI to visualize cell nuclei. Panel right shows the quantification of the mean fluorescence intensity of mitoSOX (n = 3). (G-H) Percentage of lipid peroxidation (C11-BODIPY; G) or intracellular ROS levels (H2DCF-DA; H) in AAV-shRNA transfected primary neuronal cells co-treated with AACOCF3 under OGD/R by flow-cytometry analysis (n = 3).

