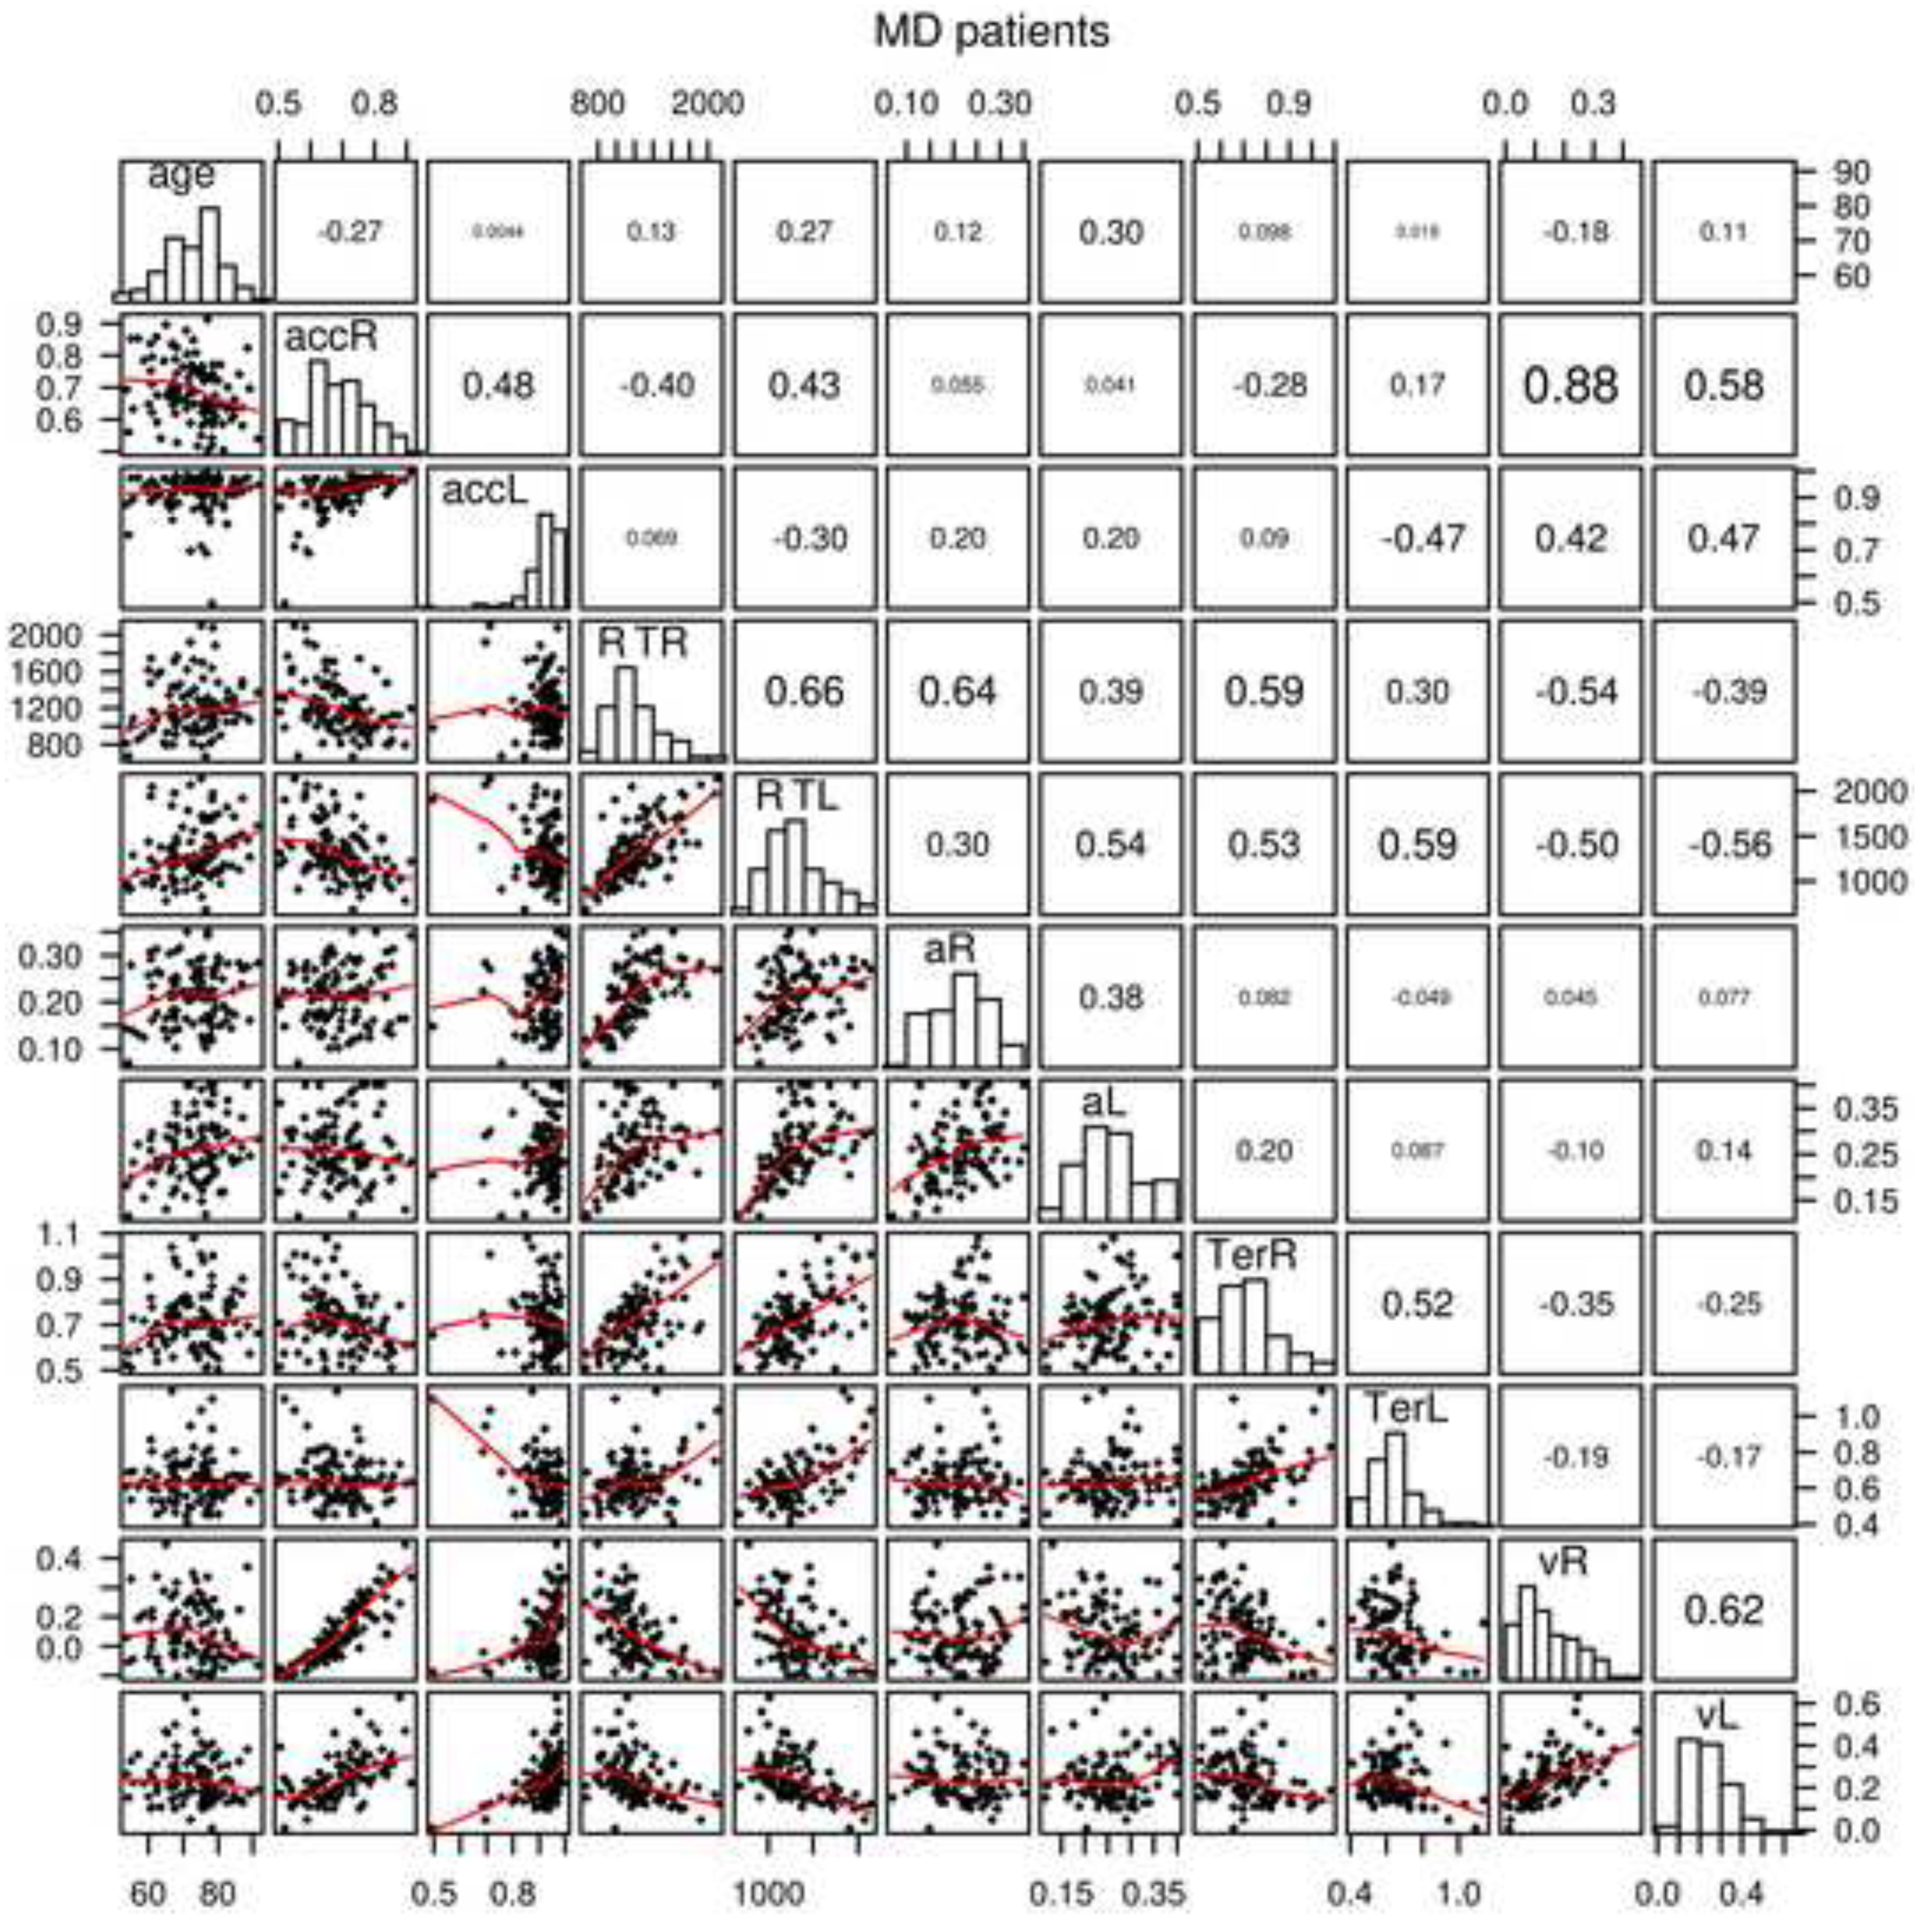
Figure 2.

Scatter plots, histograms, and correlations for age, accuracy and mean RT, and diffusion model parameters, nondecision time, boundary separation, and drift rate averaged over conditions for the MD patients. acc represents accuracy, R represents item recognition, L represents lexical decision, a represents boundary separation, Ter represents nondecision time, and v represents mean drift rate averaged over conditions.
