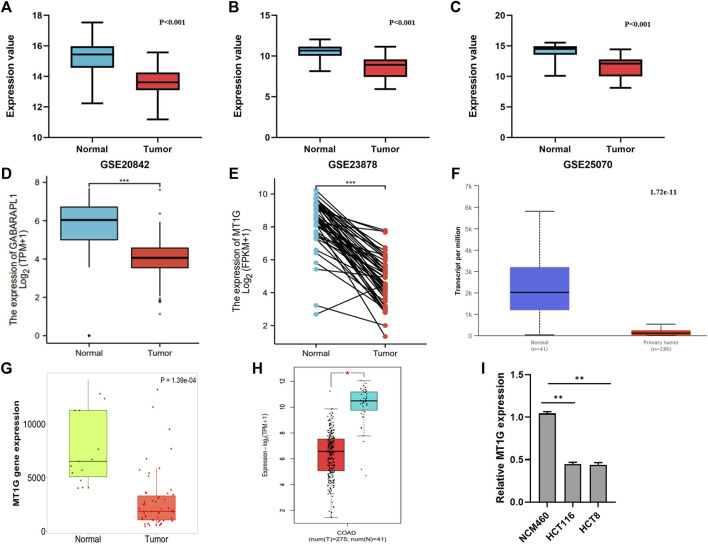
FIGURE 3.
Expression levels of MT1G verified in CRC tissues and cells. (A–H) Comparison of the MT1G expression between CRC and normal controls from (A) GSE20842, (B) GSE23878, (C) GSE25070, (D) paired TCGA-CRC, (E) unpaired TCGA-CRC, (F) UALCAN, (G) TNMplot, and (H) GEPIA2. (I) Low expression of MT1G was detected by qPCR. *p < 0.05; **p < 0.01; and ***p < 0.001.

