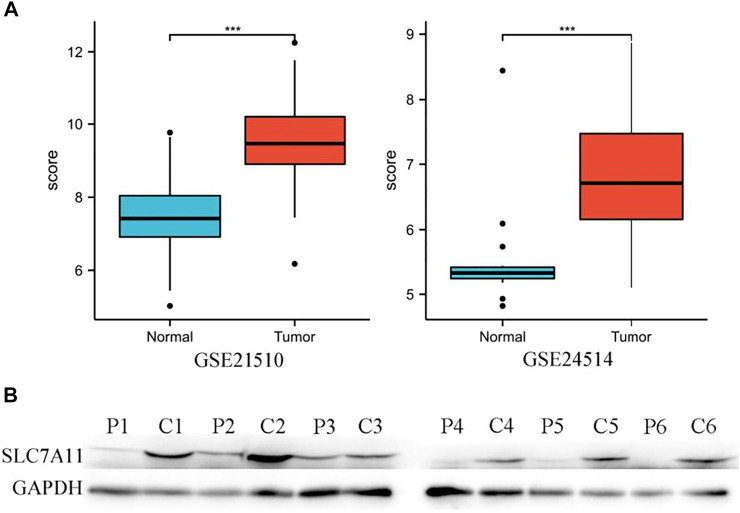
FIGURE 2.
High expression of SLC7A11 in colon cancer. (A) Analysis of SLC7A11 gene expression in GEO datasets, n (normal) = 25 and n (tumor) = 123 in GSE21510, n (normal) = 15 and n (tumor) = 34 in GSE24514. ***p < 0.001. (B) Expression levels of SLC7A11 were detected by Western blot analysis, P1-6: paracancerous tissues of patients 1–6, C1-6: cancer tissues of patients 1–6, the bands gray value of C1-6 significantly higher than the P1-6 (p < 0.01). Correlation analysis between SLC7A11 expression and infiltrating immune cells.

