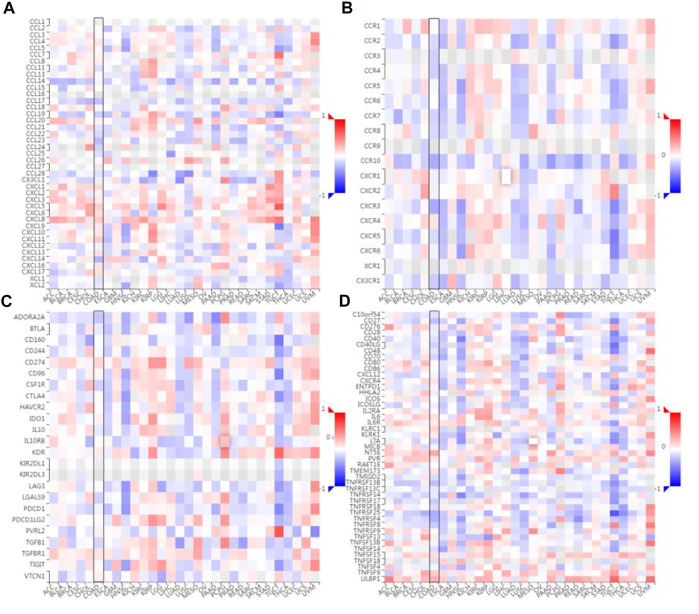
FIGURE 6.
Correlation analysis between SLC7A11 expression and immunomodulators or chemokine receptors. (A) Heatmap analysis of the correlation between SLC7A11 and chemokines in tumors. (B) Heatmap analysis of the correlation between SLC7A11 and chemokine receptors in tumors. (C) Correlation between SLC7A11 and immunoinhibitors in tumors via heatmap analysis. (D) Correlation between SLC7A11 and immunostimulators in tumors by heatmap analysis.

