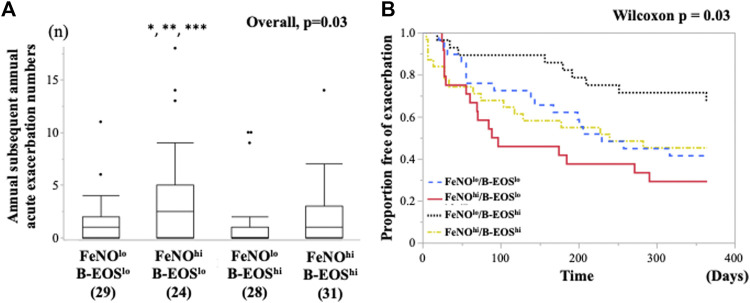
FIGURE 2.
Comparison of the future risk of asthma exacerbations after the entry between the type 2 biomarker-classified subgroups. (A) Differences in the number of annual subsequent asthma exacerbation after the entry among the subgroups classified by FeNO and B-EOS cutoff values for detection of sputum eosinophilia. Horizontal bars represent median. *vs. Low FeNO, High-b-EOS, p = 0.006; **vs. Low FeNO, Low-b-EOS, p = 0.01; ***vs. High FeNO, High-b-EOS, p = 0.04. (B) Kaplan–Meier analysis for asthma exacerbation-free time after the entry among the predominant type 2 inflammation subgroups. Generalized Wilcoxon, p = 0.048, Log Rank, p = 0.07. B-EOS, blood eosinophils; AE, asthma exacerbation.

