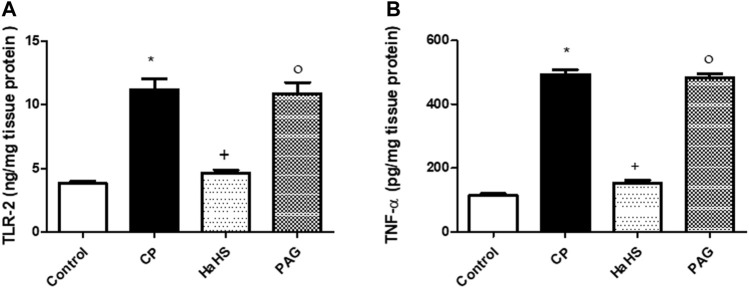
FIGURE 5.
The effect of NaHS and PAG on hepatic level of TLR-2 (A) and TNF-α (B) in CP-induced hepatotoxicity in rats. Data are represented as mean ± SEM. *,+,° are significantly different from control, CP and NaHS groups, respectively, where n = 6 and p<0.05. CP; cyclophosphamide, PAG; DL-propargylglycine, TLR2; Toll-like receptor 2, TNF-α; tumor necrosis factor-alpha.

