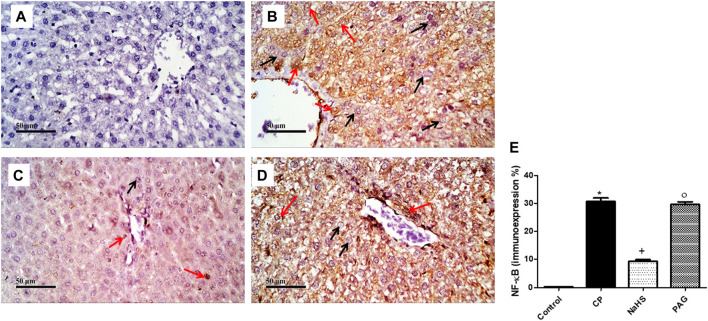
FIGURE 6.
Representative photomicrographs of immunohistochemical analysis of hepatic NF-κB protein expression (A) Control group, (B) CP group, (C) NaHS group, (D) and PAG group. All reactive hepatocytes are labeled with red arrows, while black arrows indicate negative reactive hepatocytes. (E) A semi-quantitative analysis of NF-κB in rat’s liver tissue. Data are represented as mean ± SEM. *, +, ° are significantly different from control, CP and NaHS groups, respectively, where n = 6 and p < 0.05. CP; cyclophosphamide, PAG; DL-propargylglycine, NF-κB; nuclear factor kappa B.

