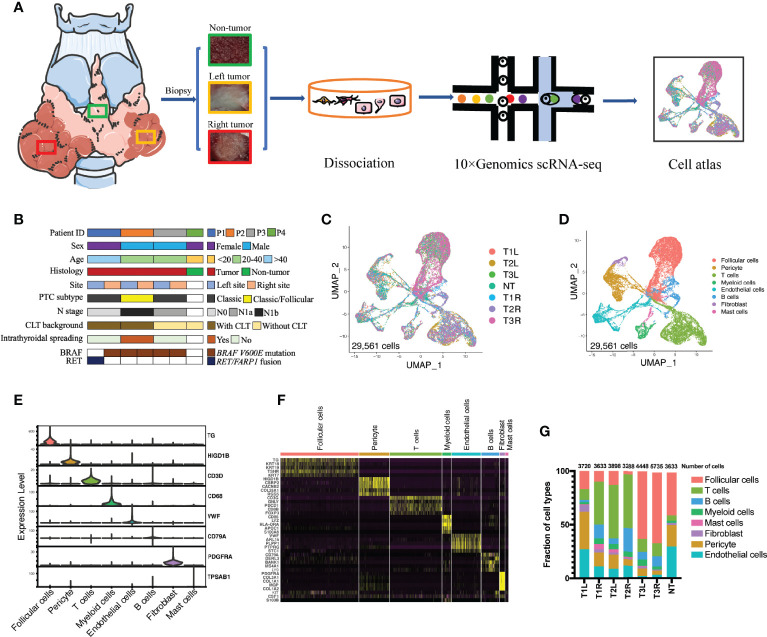
Figure 1.
Single-cell transcriptomic profiling of bilateral papillary thyroid carcinoma (PTC). (A) Schematic diagram of the single-cell transcriptomic profiling of non-tumor (NT) thyroid tissue (n = 1) and bilateral PTC (n = 3) across disease stages. (B) Clinical and pathological characteristics of the patient cohort with the distribution of mutation events. (C) All PTC and NT thyroid tissues were well represented in the dataset. Uniform manifold approximation and projection (UMAP) for dimension reduction colored by tissue origin (total number of cells = 29,561). (D) Single-cell RNA sequencing (scRNA-seq) analysis revealed eight known cell lineages (cell populations labeled; total number of cells = 29,561). (E) Violin plots showing the smoothed expression distributions of canonical marker genes in the eight cell lineages. (F) Heatmap of the top 5 signature genes in each cell lineage. (G) Proportion of each cell lineage in seven samples. T1L and T1R: PTC from the left lobe and right lobe of patient P1, respectively. T2L and T2R: PTC from the left lobe and right lobe of patient P2, respectively. T3L and T3R: PTC from the left lobe and right lobe of patient P3, respectively.

