
Fig. 4.
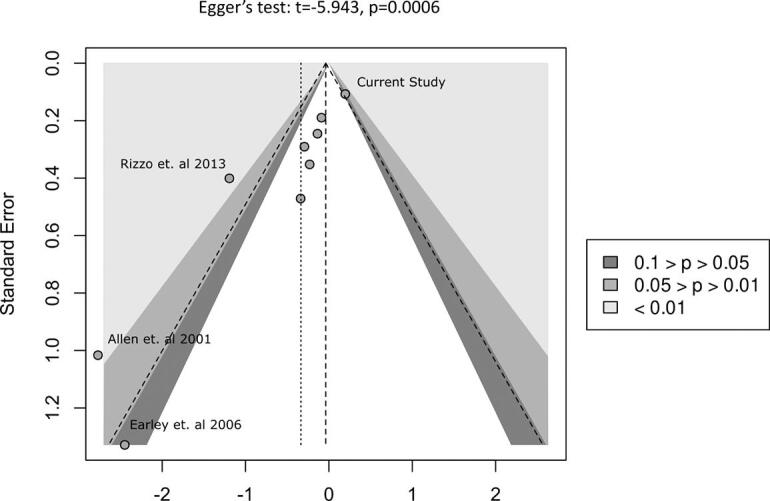
Funnel plot presenting the pooled SMD of the different studies relative to their standard error for the substantia nigra. The different shadings (light, medium, and dark grey) represent respective confidence intervals. The vertical dashed lines indicate the estimated effect (left) and the null (center).